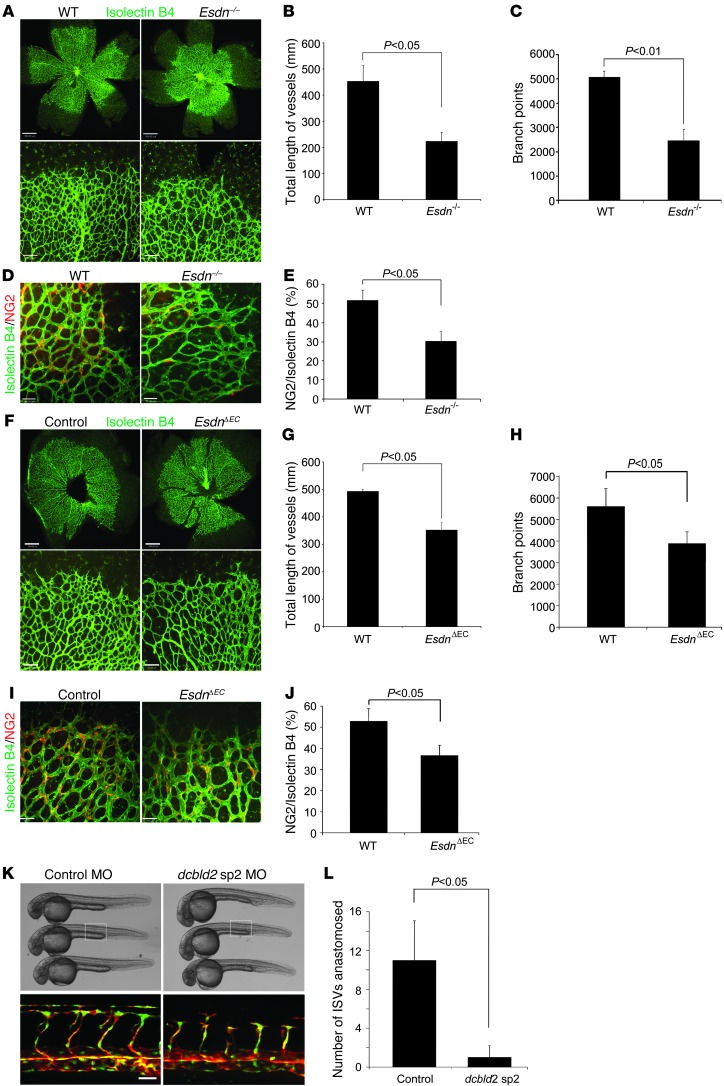
Figure 5. ESDN/dcbld2 modulates developmental angiogenesis in mice and zebrafish.
(A–E) Retinal angiogenesis in Esdn–/– mice. Representative examples (A) and quantification in the entire retina (B and C) of isolectin staining of blood vessels in WT and Esdn–/– mice on postnatal day 5. n = 12. Scale bars: 500 μm, upper panels; 100 μm, lower panels. (D and E) Retinal pericyte staining. Representative examples (D) and quantification (E) of NG2 immunostaining of retinal blood vessels in WT and Esdn–/– mice on postnatal day 5. n = 6. Scale bars: 50 μm. (F–J) Retinal angiogenesis in EC-specific Esdn knockout mice. Representative examples (F) and quantification in the entire retina (G and H) of isolectin staining of blood vessels in Esdnfl/–/VE-cadherin Cre mice and their control Esdnfl/– littermates on postnatal day 5. n = 8. Scale bars: 500 μm upper panels, 100 μm lower panels. (I and J) Retinal pericyte staining. Representative examples (I) and quantification (J) of NG2 immunostaining of retinal blood vessels in Esdnfl/–/VE-cadherin Cre mice and their control Esdnfl/– littermates on postnatal day 5. n = 8. Scale bars: 50 μm. (K and L) Vascular development in zebrafish. (K) Brightfield (upper panels) and epifluorescence (lower panels) images of 28 hpf Tg(fli1:nEGFP);Tg(kdrl:mCherry) zebrafish embryos (head to the left) injected with control or dcbld2/esdn sp2 MO. In embryos injected with dcbld2MO, intersegmental vessels often consist of slender endothelial cells and/or are stalled along their dorsal trajectory. Nuclei of fli1-positive cells are shown in green and kdrl-positive cells in red. Scale bar: 25 μm. (L) Quantification of the number of ISVs anastomosed per embryo (n = 20 in each group).

