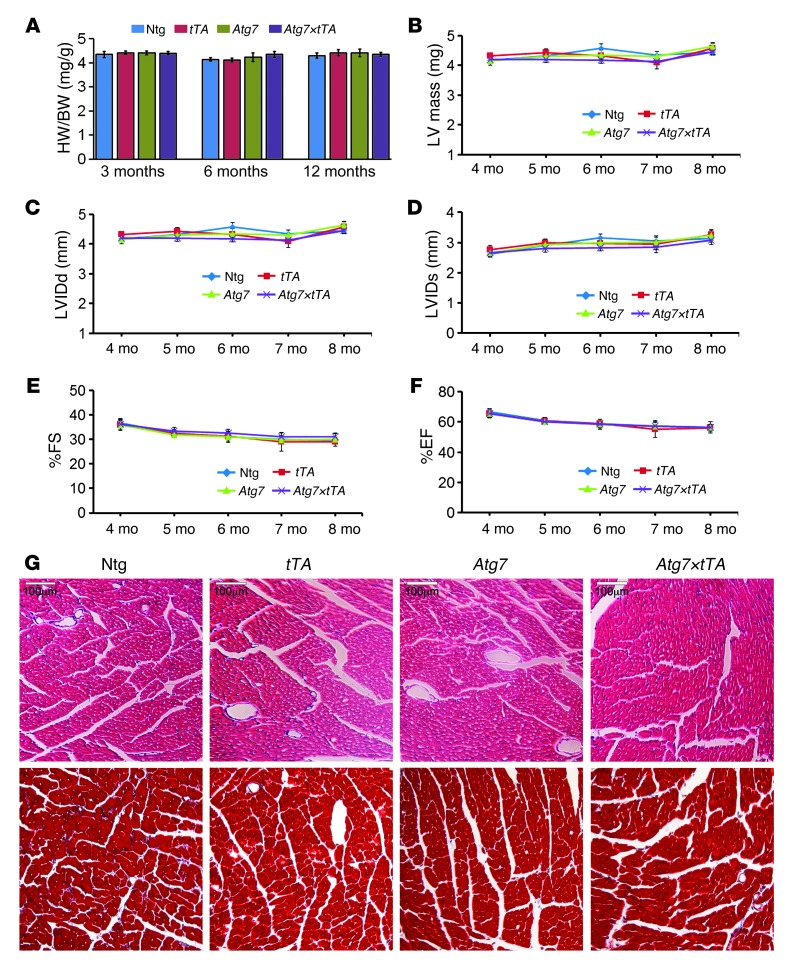
Figure 3. Cardiac function and histology of Atg7×tTA mouse hearts.
(A) HW/BW ratios at 3, 6, and 12 months in Ntg, tTA-Tg, Atg7-Tg, and Atg7×tTA mice (n ≥ 6 per group). (B) Serial changes in LV mass index by echocardiography across genotypes, indicative of normal heart size. (C–F) Effect of Atg7 overexpression on echocardiography indices of LV end-diastolic diameter, measured by (C) LVIDd and (D) LVIDs, and LV function, measured by (E) %FS and (F) %EF (n ≥ 10 per group). (G) H&E (top) and Masson’s trichrome (bottom) staining of cardiac histological sections from 6-month-old mice showed no differences or overt pathology with Atg7 overexpression. Scale bars: 100 μm.

