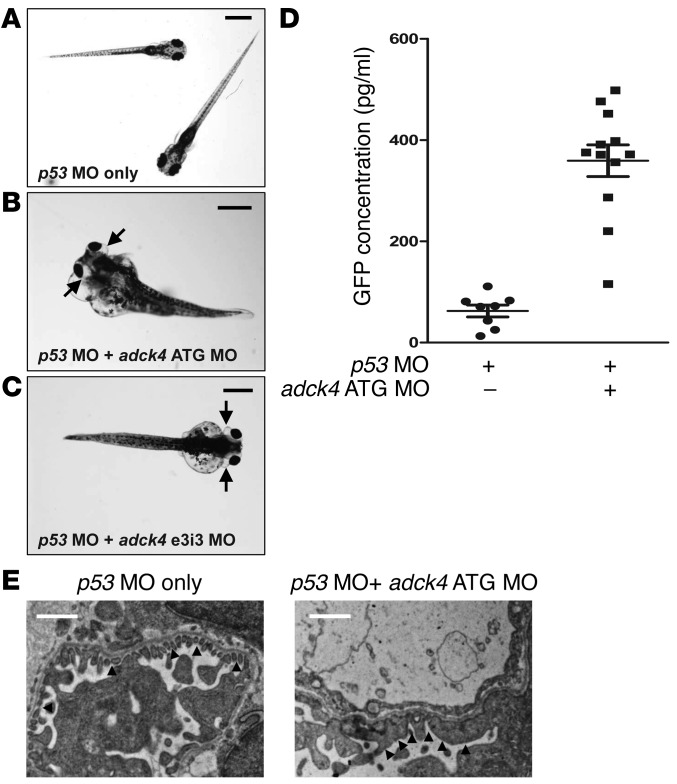
Figure 2. Functional analysis of adck4 knockdown in zebrafish.
(A) Control zebrafish were injected with p53 MO (0.2 mM) as a control to minimize nonspecific MO effects. p53 MO was injected into fertilized eggs at the 1- to 4-cells stage and did not produce any phenotype up to 168 hpf (n >100). Scale bar: 0.5 mm. (B) Zebrafish coinjected with adck4 ATG MO (0.2 mM) targeting the translation initiation site of zebrafish adck4 and with p53 MO. At 120 hpf, adck4 morphants display the nephrosis phenotype of periorbital edema (arrows) and total body edema in 54.1% (193 out of 357) of embryos. (C) Zebrafish coinjected with adck4 e3i3 MO (0.2 mM) targeting the donor site of intron 3 of zebrafish adck4 and with p53 MO. At 120 hpf, adck4 morphants display the nephrosis phenotype (arrows) in 48.3% (274 out of 567) of embryos. Scale bar: 1 mm (B and C). (D) Proteinuria assay by ELISA against a fusion protein of vitamin D–binding protein and GFP in l-fabp::VDBP-GFP transgenic zebrafish. Note that knockdown of adck4 causes significant proteinuria compared with that in control fish injected with p53 MO only. (P < 0.001). Symbols indicate each measurements; horizontal bars indicate the average; data are presented with the average ± SEM denoted by 3 horizontal lines. (E) Electron microscopic ultrastructure of GBM and podocyte foot processes in p53 MO control and adck4 morphant zebrafish. In the control zebrafish, the foot processes are regularly spanned by slit diaphragms (black arrowheads). In contrast, the foot processes of the morphants are effaced and disorganized (black arrowheads). Scale bar: 2 μm.

