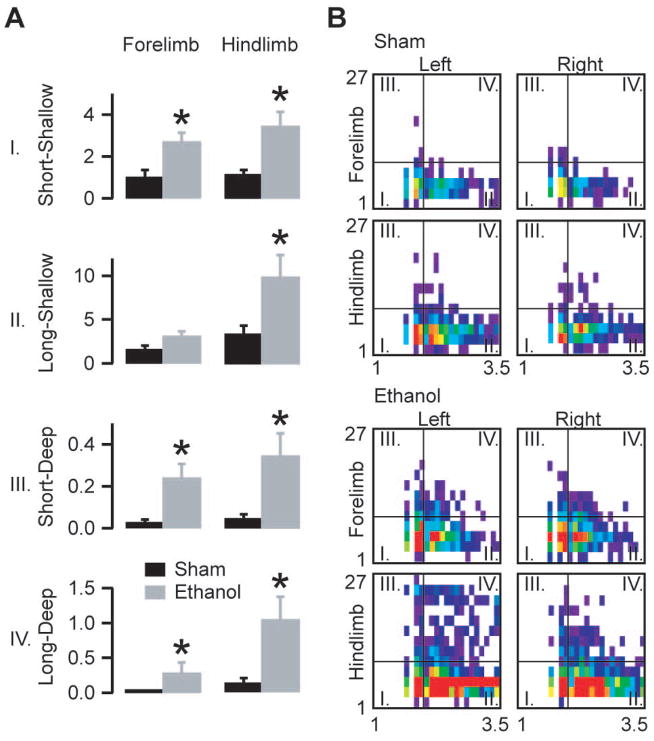
Figure 3.
Movement characteristics after a moderate dose of ethanol. A) Average normalized fault numbers in the quadrants of the duration-depth matrices. B) Averaged and distance normalized duration-depth matrices for the four limbs divided into four quadrants as indicated in the legend of Fig 2B. Note the appearance after ethanol administration of very long faults, especially on the hind limbs. The horizontal axes of the matrices denote fault duration (log scale), the vertical axes indicate depth in pixels (asterisks mark statistically significant differences p<0.05; bars show mean ± s.e.m, n=8 ethanol injected animals, n=8 saline injected animals; unpaired two-tailed t-test, forelimb short-shallow p=0.007; forelimb long-shallow p=0.1; forelimb short-deep p=0.008; forelimb long-deep p=0.02; hind limb short-shallow p=0.009; hind limb long-shallow p=0.03; hind limb short-deep p=0.02; hind limb long-deep p=0.01).

