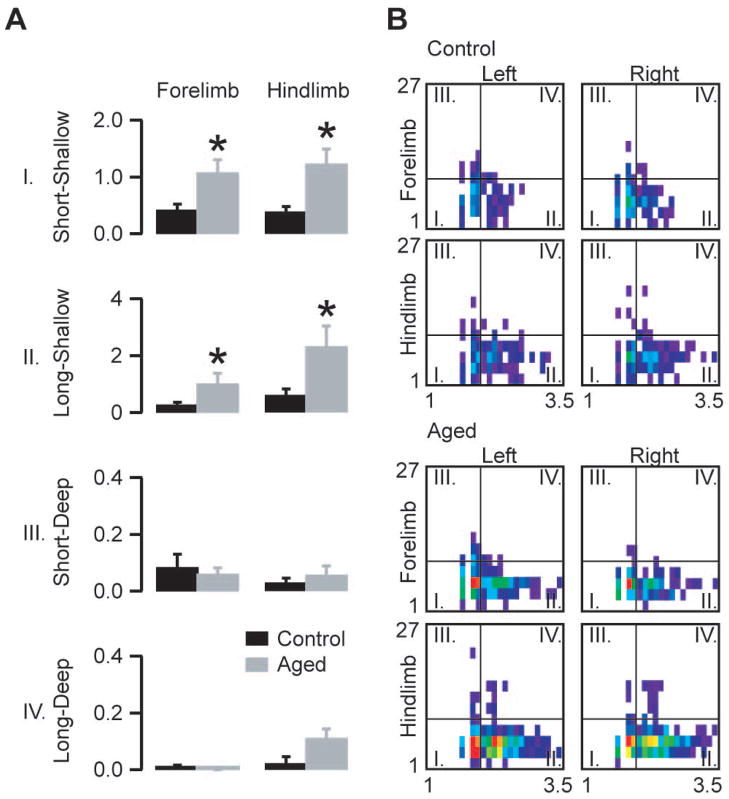
Figure 5.
Fault characteristics in aged (96–99 weeks old) mice compared to young adult (8–12 weeks old) mice. A) Average normalized fault numbers in the quadrants of the duration depth matrices. B) Averaged and distance normalized duration-depth matrices for the four limbs divided into four quadrants as indicated in the legend of Fig 2B. Note that the most prominent differences between old and young adult mice are in the numbers of shallow events. The horizontal axes of the matrices denote fault duration (log scale), the vertical axes indicate depth in pixels (asterisks mark statistically significant differences, unpaired two-tailed t-test, p<0.05; bars show mean ± s.e.m, n=6 aged animals, n=6 young adult animals; forelimb short-shallow p=0.01; forelimb long-shallow p=0.04; forelimb short-deep p=0.6; forelimb long-deep p=0.3; hind limb short-shallow p=0.005; hind limb long-shallow p=0.03; hind limb short-deep p=0.3; hind limb long-deep p=0.06)

