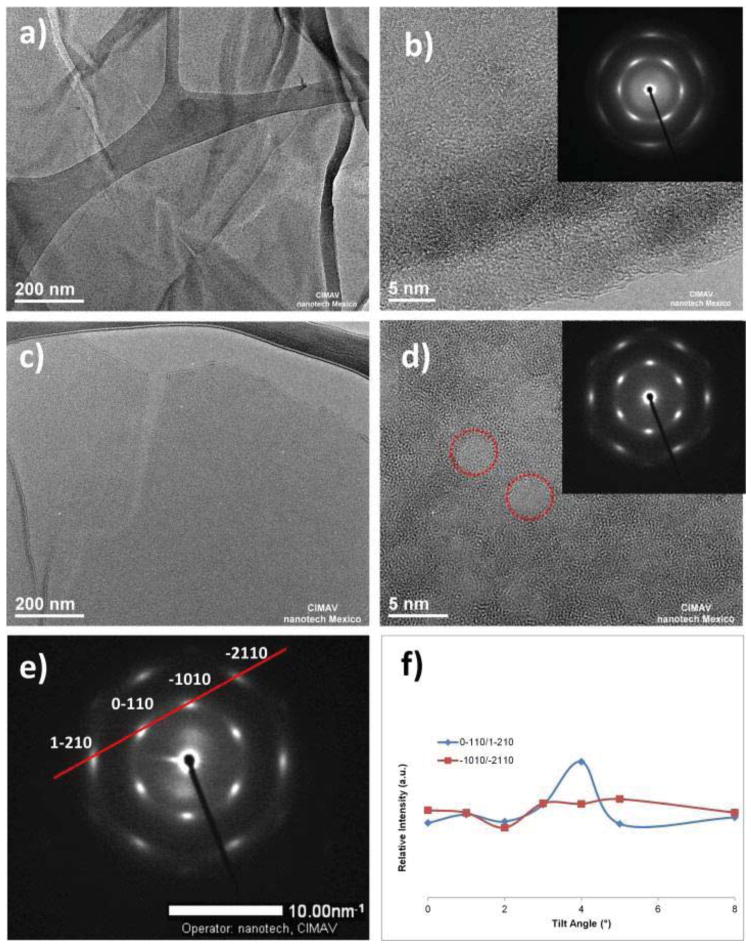
Figure 10.
a) Low-magnification HRTEM image of GO exhibiting typical wrinkles in most of sheets; b) High-magnification HRTEM image of GO showing amorphous and crystalline zones; c) Low-magnification HRTEM image of GOFT1 showing a single layer of graphene-functionalized; d) High-magnification HRTEM image of GOFT1 exhibiting amorphous and crystalline zones; e) SAED from GOFT tilted 8° respect to the incident beam, showing a hexagonal symmetry; and f) Spots intensities ratio at several tilts from GOFT1.

