
Figure 1.
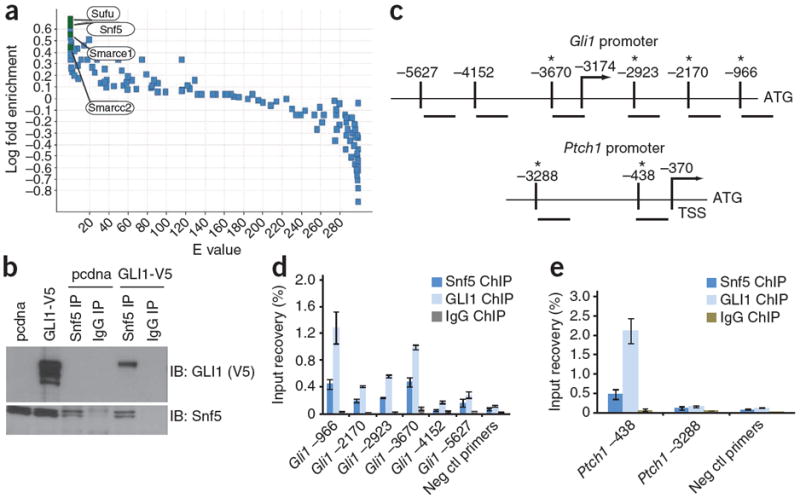
Snf5 interacts with GLI1 and localizes to Gli1 regulated promoters. (a) All proteins precipitated by TAP-GLI and detected by mass spectrometry are indicated by a single data point. The y axis shows the log10 fold ratios comparing the frequency with which each mouse protein was detected in the TAP-GLI1 protein purifications relative to the 26 TAP-protein purifications in our entire mouse database. The x axis shows the associated expected (E) values calculated using binomial statistics corrected for multiple hypotheses (false discovery rate–corrected P values not shown). (b) Immunoblot of GLI1 in whole-cell lysates from TM3 cells transfected with a vector control (pcdna) or GLI1-V5-tagged vector (shown in the first two lanes), and from GLI1-V5 expressing lysates subjected to immunoprecipitation (IP) of endogenous Snf5 with a Snf5-specific antibody or a control IgG (as indicated in lanes three through six). (c) Schematic of the mouse Gli1 and Ptch1 promoters showing locations of primers relative to the ATG translation initiation site. The arrow shows the location of the transcriptional start site (TSS) and the asterisk (*) denotes proximity of the primer set to sequences resembling the Gli1 recognition sequence. (d,e) Quantitative PCR (qPCR) with primers binding the locations depicted in c, showing percentage input recoveries of Snf5 and GLI1 at the Gli1 (d) and Ptch1 (e) promoters in ChIP performed with TM3 GLI1-V5 cells with a Snf5-specific antibody, a V5-specific antibody or a rabbit IgG. qPCR was performed in triplicate and input recovery (%) is shown as mean ± s.d. Ctl, control.