
Figure 7.
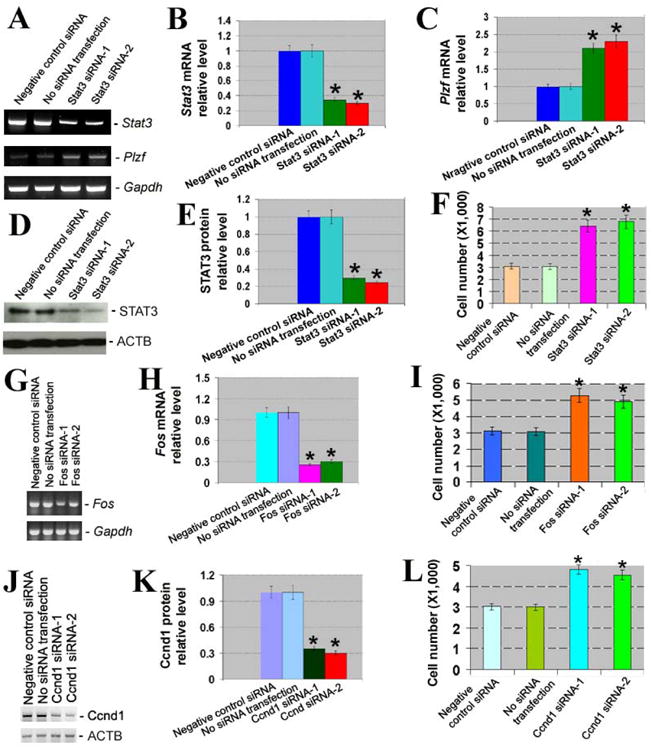
Knockdown of Stat3, Fos, and Ccnd1 and its effects on proliferation of SSCs. (A) RT-PCR showed the expression of Stat3 and Plzf after Stat3 silencing. Gapdh served as a loading control of total RNA. (B) Relative expression of Stat3 to Gapdh after silencing of Stat3. Compared to negative control siRNA, “*” indicated a significant difference (P <0.05). (C) Relative expression of Plzf to Gapdh after silencing of Stat3. Compared to negative control siRNA, “*” indicated a significant difference (P <0.05). (D) Western blots revealed STAT3 expression after Stat3 silencing. ACTB served as a loading control of total protein. (E) Relative expression of STAT3 to ACTB after silencing of Stat3. Compared to negative control siRNA, “*” indicated a significant difference (P <0.05). (F) Proliferation assay displayed cell number of SSCs by Stat3 siRNAs. Compared to negative control siRNA, “*” indicated a significant difference (P <0.05). (G) RT-PCR showed the expression of Fos after Fos silencing. Gapdh was used as a loading control of total RNA. (H) Relative expression of Fos to Gapdh after silencing of Fos. Compared to negative control siRNA, “*” indicated a significant difference (P <0.05). (I) Proliferation assay displayed cell number of SSCs by Fos siRNAs. Compared to negative control siRNA, “*” indicated a significant difference (P <0.05). (J) Western blots revealed Ccnd1 expression after Ccnd1 silencing. ACTB served as a loading control of total protein. (K) Relative expression of Ccnd1to ACTB after silencing of Ccnd1. Compared to negative control siRNA, “*” indicated a significant difference (P <0.05). (L) Proliferation assay displayed cell number of SSCs by Ccnd1 siRNAs.