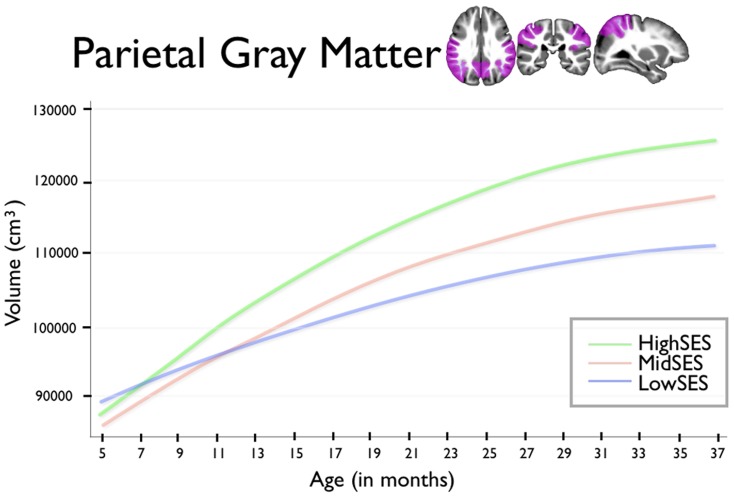
Figure 4. This figure shows parietal lobe gray matter volumes for group by age.
Age in months is shown on the horizontal axis, spanning from 5 to 37 months. Total gray matter volume is shown on the vertical axis. The blue line shows children from Low SES households; children from Mid SES households are shown in red. The green line shows children from High SES households.

