
Figure 8. Comparison of HIV-1 RNA load within clustered and non-clustered sequences in ART-naïve individuals.
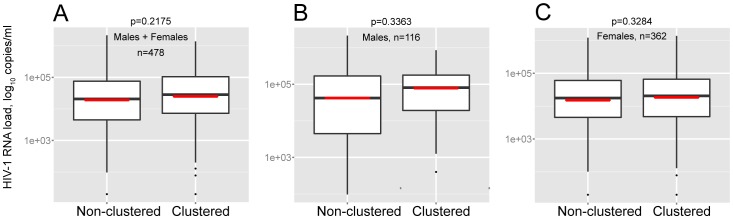
The estimated p-values by Wilcoxon test are shown above each graph. A: The entire set of ART-naïve individuals. B: ART-naïve males. C: ART-naïve females.