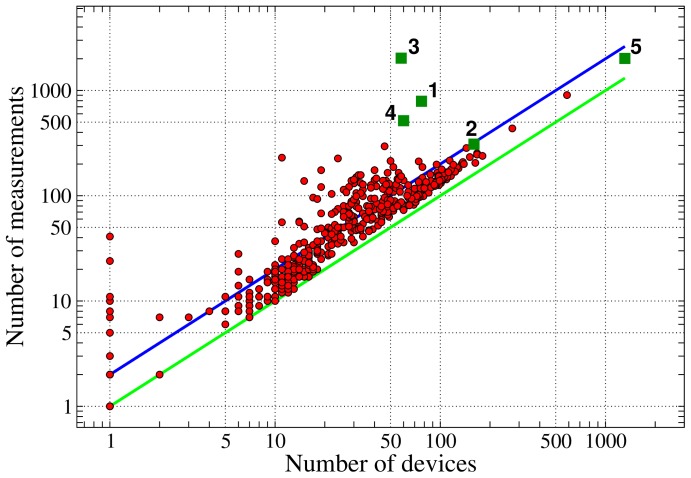
Figure 6. Measurements versus devices.
Scatter plot of the number of measurements collected each day compared to the number of active devices at that day. The dark green symbols correspond to the most important spikes shown also in Figure 5. The green and blue lines are guides for the eye and correspond to the case of one measure per device and two measures per device respectively.

