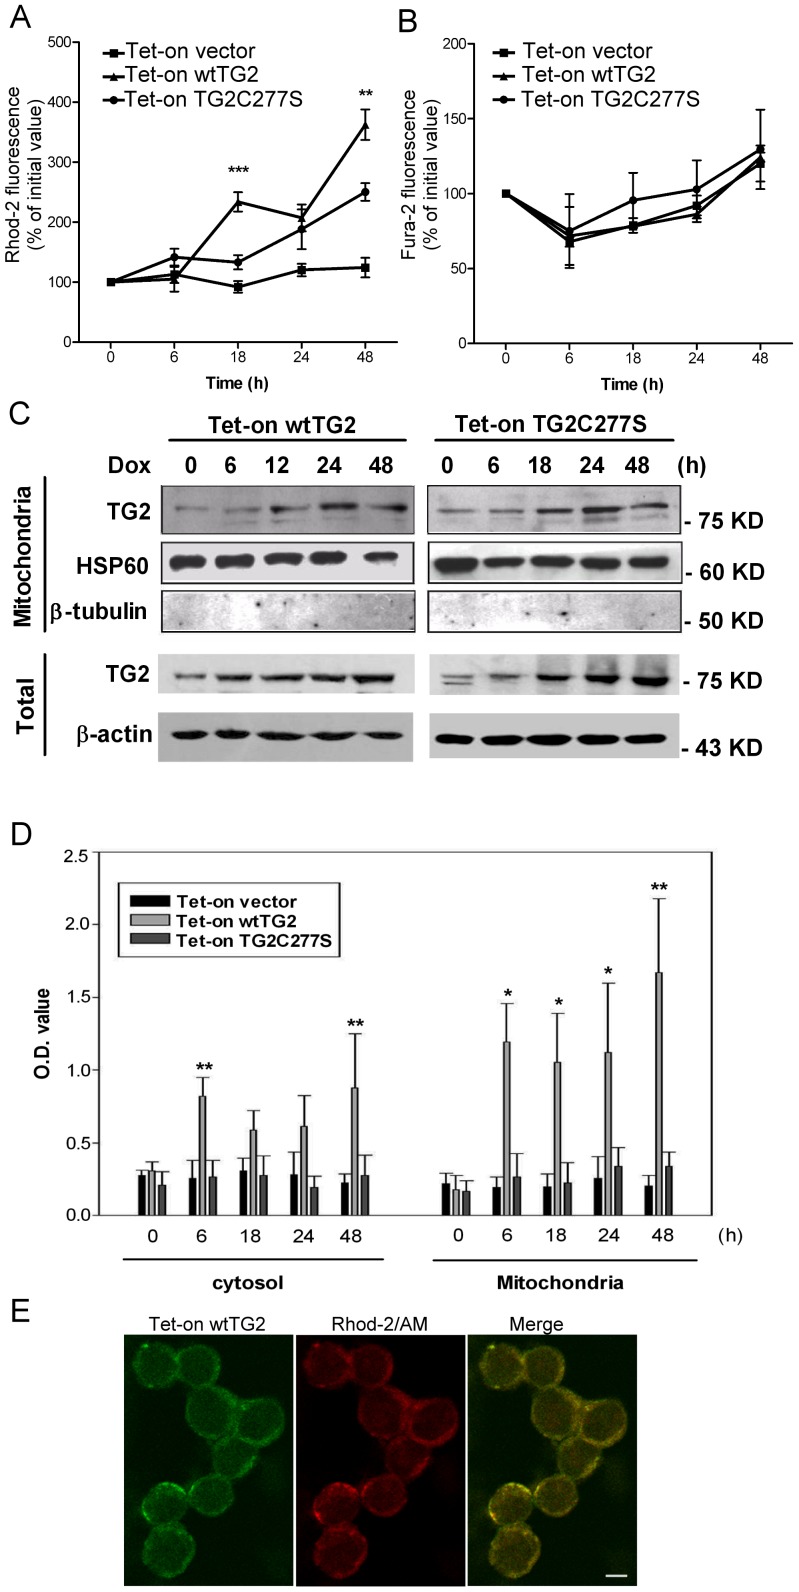
Figure 2. Overexpressed wtTG2 appears in the mitochondria and induces enhanced mitochondrial Ca2+ accumulation.
(A) Time dependent changes in the mitochondrial Ca2+ concentrations of Tet-on vector, Tet-on wtTG2 and Tet-on TG2C277S cells following Dox (50 µM) treatment detected by Rhod-2/AM. (B) Time dependent changes in the cytosolic Ca2+ concentrations of Tet-on vector, Tet-on wtTG2 and Tet-on TG2C277S cells following Dox (50 µM) treatment detected by Fura-2/AM. (C) Time dependent changes in the mitochondrial and cytoplasmic TG2 expressions of Tet-on wtTG2 and Tet-on TG2C277S cells following Dox (50 µM) treatment detected by Western blot analysis. Mitochondrial HSP60 and cytoplasmic β-actin were used as loading controls; while β-tubulin was used to check for cytoplasmic contamination of mitochondria. (D) Time dependent changes in the mitochondrial and cytoplasmic TG2 activities of Tet-on vector, Tet-on wtTG2 and Tet-on TG2C277S cells following Dox (50 µM) treatment. (E) Confocal images taken at 16 h following Dox treatment show Tet-on wtTG2 cells expressing TG2 (green) colocalized with the mitochondrial calcium indicator Rhod-2/AM (red). Scale bar = 5 µM. All the data presented represent mean±S.D. of at least three determinations. Significantly different from the TG2C277S cell line detected at the same time point (*P<0.5; **P<0.01; ***P<0.001).

