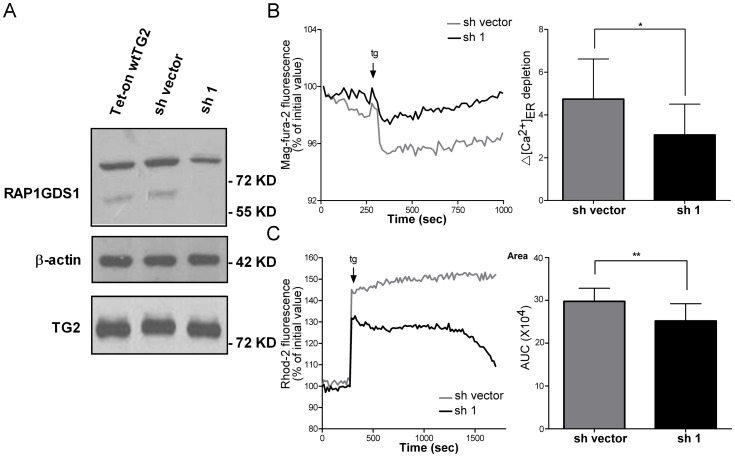
Figure 6. RAP1GDS1 mediates the enhancing effect of TG2 on the calcium release from ER and on the subsequent mitochondrial Ca2+ uptake.
(A) RAP1GDS1 and TG2 protein expression levels detected by Western blotting in Tet-on wtTG2, Tet-on wtTG2 with sh vector and Tet-on wtTG2 with shRAP1GDS1 (sh1) cells following 18 hours Dox (50 µM) treatment. β-actin was used as loading control. Tet-On wtTG2 with sh vector and sh1 cells treated with Dox for 18 hours were exposed to 5 µM thapsigargin. (B) A representative recording of the tg-induced Ca2+ release from the ER recorded by Mag-Fura-2/AM fluorescence is shown. Right panel, statistical evaluation of the tg-induced ER Ca2+ depletion. (C) A representative recording of the tg-induced intra-mitochondrial Ca2+ changes is shown. Right panel, Area, statistical evaluation of integrated Ca2+ response. AUC, area under the curve. These data are representative of at least three experiments and shown as mean ± SD. *, P<0.05; **, P<0.01.

