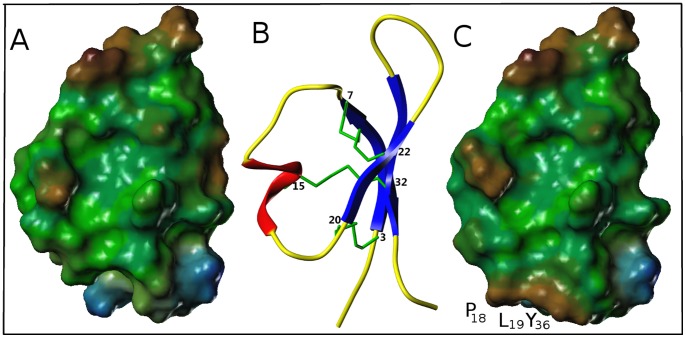
Figure 5. Lipophilic potentials of the PA1b isoforms 1 and 3.
Lipophilic potentials, calculated with the MOLCAD option of SYBYL, at the Connolly surfaces of (A) PA1b isoform 1 and (C) isoform 3, and (B) ribbon representation of the PA1b isoform 1 NMR structure (the disulfide bridges are shown in green). Figures A and C are the same orientation as figure B, using a common hydrophobic scale. Hydrophobic and hydrophilic areas are displayed in brown and blue, respectively. Green surfaces represent an intermediate hydrophobicity.

