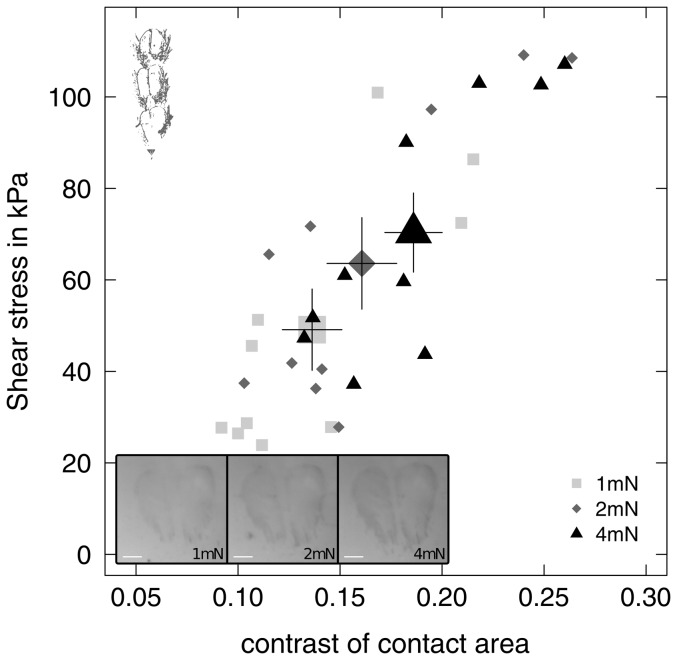
Figure 7. Shear stress (friction per unit projected contact area) of a single pair of euplantulae of Carausius morosus plotted against the optical contrast of the contact area for three normal loads (n = 10 for each level).
Inset shows an example of the euplantula contact zone at 1,2 and 4(from left to right). Large symbols indicate the mean contrast and shear stress for each normal load with the corresponding standard error of the mean.

