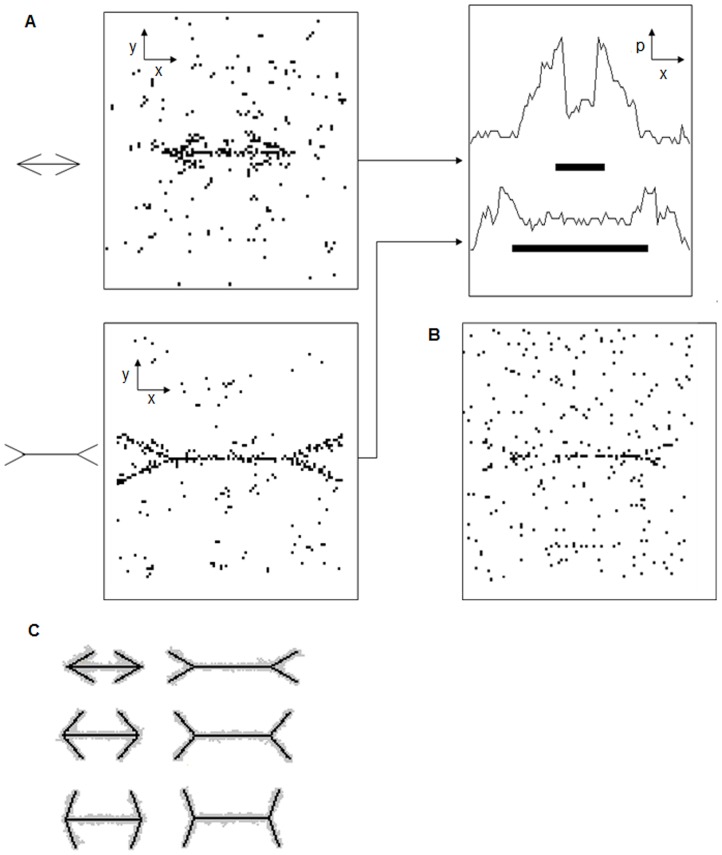
Figure 9. Results of the foraging ant simulation model.
(a). Steady-state patterns generated by 300 ants initially distributed randomly with food sources distributed along the wings-in (upper left) and wings-out (lower left) Müller-Lyer figures and peak length plotted against the position along the x-axis (right). The movement rules described in Figure 6 are operated asynchronously. (b) Steady-state patterns under the same conditions as (a) except with synchronous updating. (c). Accumulated patterns over 6000 time steps, for various Müller-Lyer figures. A gray cell represents the cell with high density exceeding 300 ants per cell, and black represents the food source.

