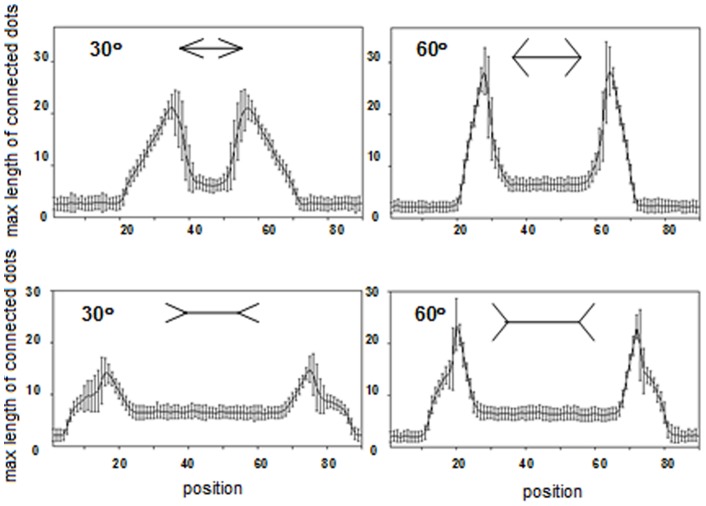
Figure 11. Application of lateral deviation versus position along the x-axis for various wing angles to calculate the mean effect of the Müller-Lyer illusion.
The curve represents the mean value over 100 samples. Each sample represents 10,000 cumulative snapshots of simulations. The vertical bars along the curve represent the standard deviation.

