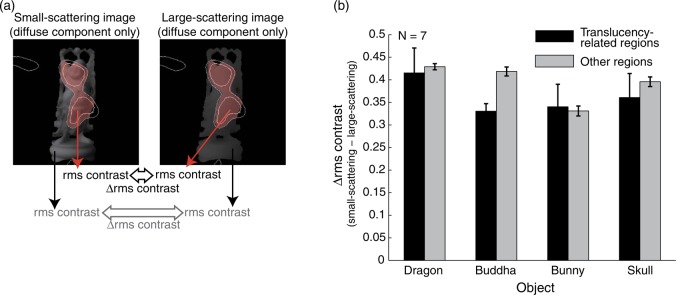
Figure 11.

(a) Schematic of the analysis procedure for the local rms contrast difference between large- and small-scattering images. (b) Difference in rms contrast between large- and small-scattering images within translucency-related regions and other regions.
