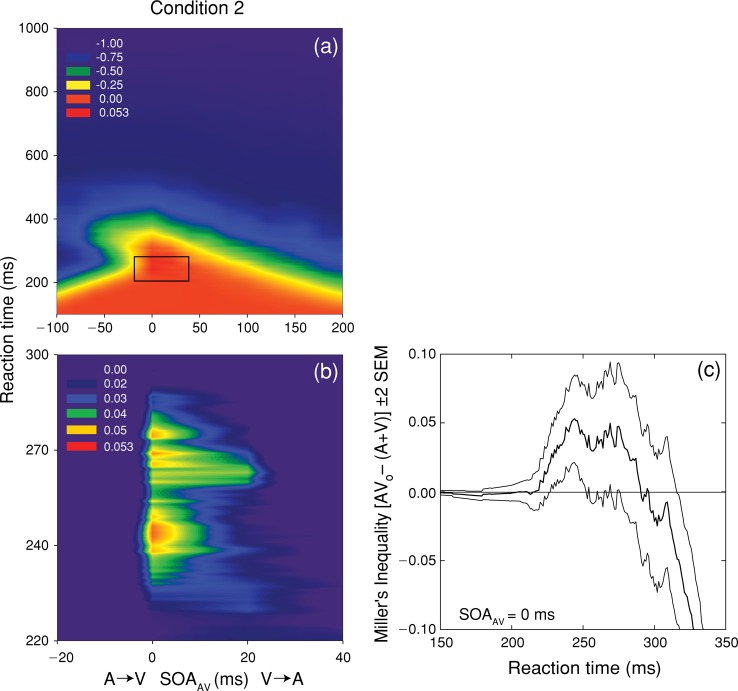
Figure 6.
Test of the race model for condition 2. Panel (a) shows spectrum-coded mean values of Miller's inequality as a function of RT and SOAAV. Panel (b) shows a magnified view of the region exhibiting significant (p < 0.05) violations of the race model that occurred at SOAAV values of 0 and 20 ms. Panel (c) plots the mean value (thick line) and 95% confidence intervals (thin lines) for Miller's inequality as a function of RT for simultaneous SOAAV.

