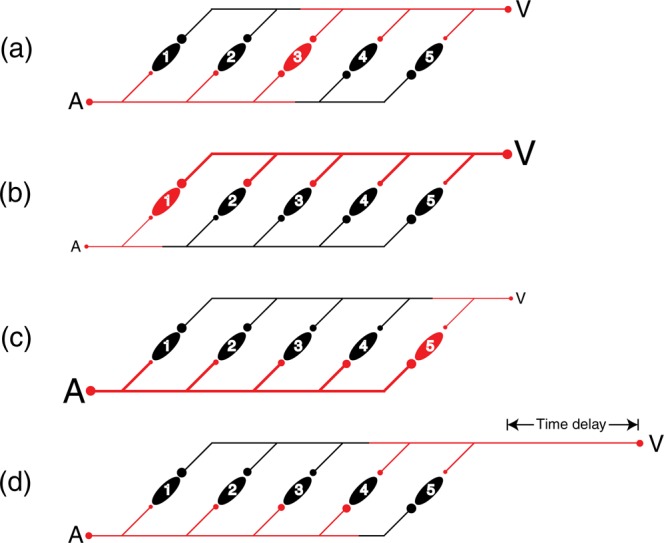
Figure 9.

An illustration of how learned associations (Bayesian priors) between physical simultaneity and relative stimulus intensity might be represented in a place-coded delay line network of coincidence detectors. Panels (a–c) refer to situations where physically simultaneous A and V events vary in relative intensity. In panel (a), the A and V inputs are of nominally equivalent relative intensity (denoted by the similar size of the delay lines, lettering, and the circular input and synaptic symbols), and the afferent signals (coded red) converge synchronously on and activate coincidence detector 3 (red). In panels (b) and (c), simultaneous A and V events vary in intensity. The more intense stimulus (thick line) propagates through the network more rapidly than the less intense stimulus (thin line), and their signals thus converge on coincidence detectors 1 or 5. Panel (d) illustrates two inputs of nominal equivalent intensity where the visual stimulus is delayed in time of onset relative to the auditory stimulus (represented here as added pathway length).
