
Figure 2. Effects of restricted sleep on cortisol and leukocyte numbers.
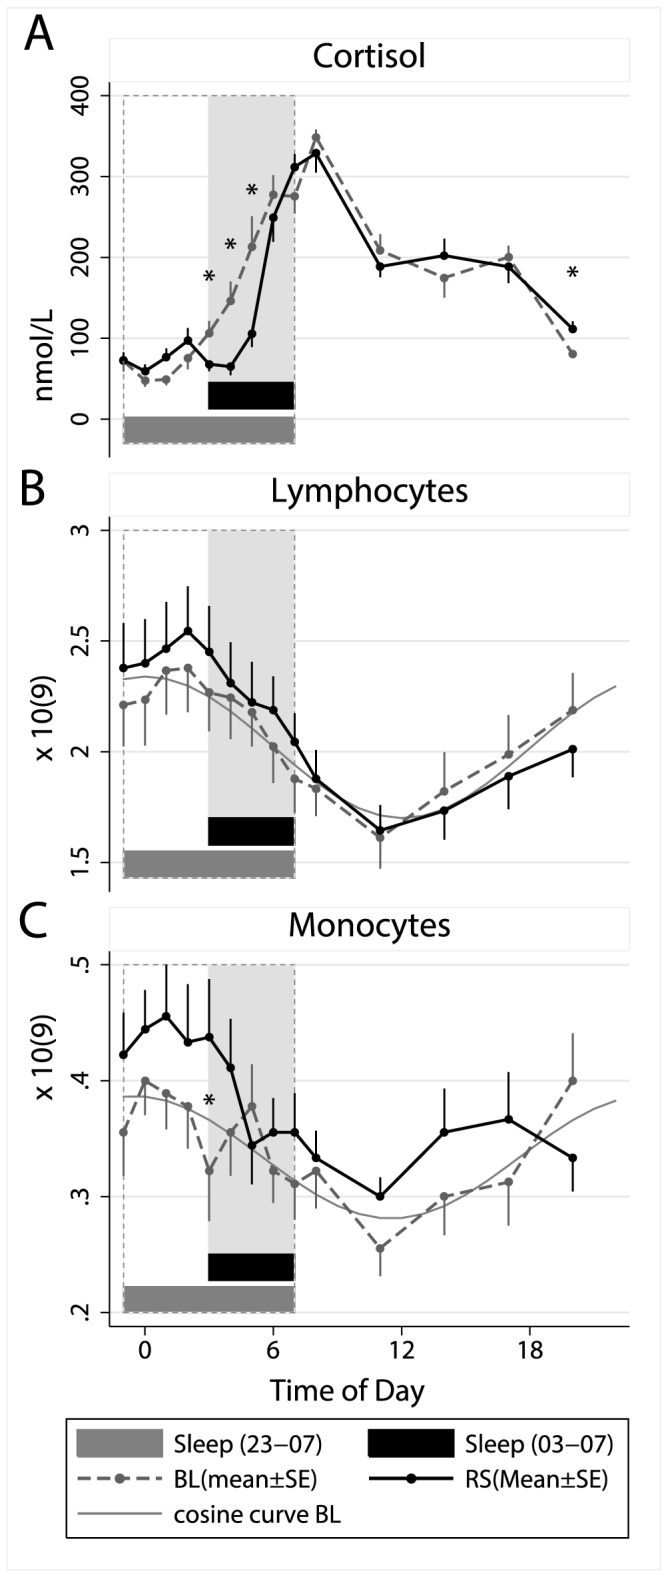
Means ± SE numbers of (A) cortisol, (B) lymphocytes and (C) monocytes during a baseline sleep-wake cycle (BL=sleep 23.00–07.00 h) and after five days with restricted sleep (RS=sleep 03.00–07.00 h). Grey lines illustrate adapted cosine curves of confirmed circadian rhythm during baseline; shaded area depicts sleep time during restricted sleep (03.00–07.00 h) and dashed box depicts baseline sleep (23.00–07.00 h).