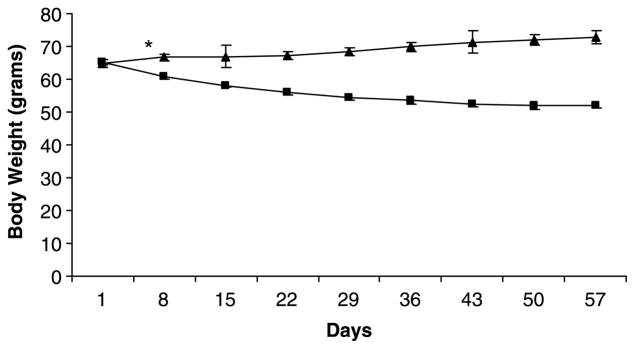
Figure 1.

Pattern of mean (±SEM) body weight of control animals (triangles) and PEM animals (squares) over 57 days, n = 12. *Indicates the point at which a significant difference in body weight was first detected between control and PEM animals, and this was sustained throughout the feeding period.
