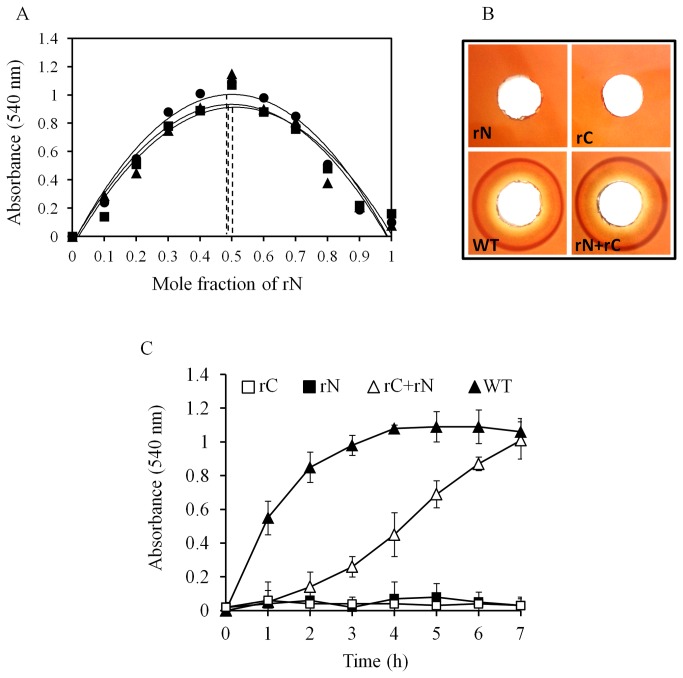
Figure 5. Characterization of haemolytic activity of N and C-domain mixture.
(A) Job’s plot showing 1:1 complex formation for Cp-PLC rN and rC domain. Ten percent mouse erythrocytes were treated for 2h with varying molar fractions of N-domain with respect to C-domain keeping the total concentration constant (10 µM) and the absorbance of the mRBC supernatant was measured as a function of the molar fraction of N-domain on X axis. Results of three replicates were plotted separately. (B) Haemolysis assay for rN, rC, mixture of rN and rC and wild type Cp-PLC. All the protein mixes were spotted onto mouse blood agar plates and incubated at 37 °C for 4 h. (C) Kinetics of haemolysis. 5% mouse erythrocytes added with 10 micromoles each of rN, rC, mixture of rN and rC and wild type Cp-PLC proteins were incubated at 37 °C for 7 h. Absorbance of supernatants were recorded at 544 nm for every 1 h.

