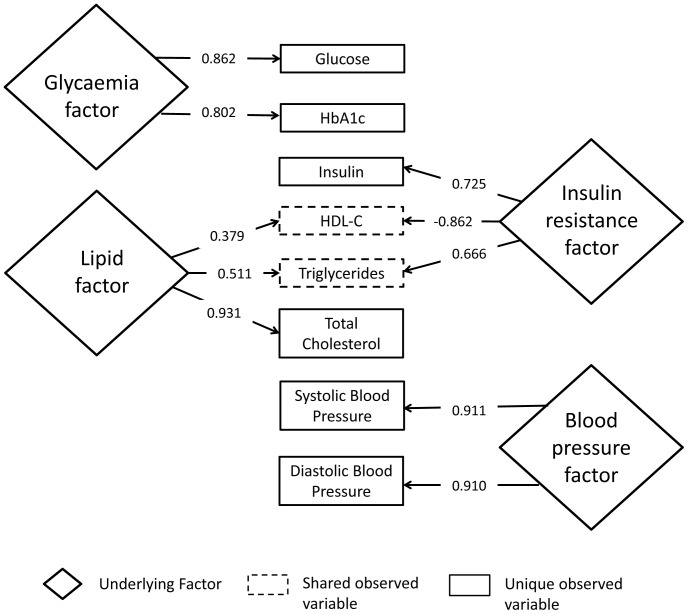
Figure 1. Relationship between measured variables and underlying latent factors.
Numbers in arrows show factor loadings. Relationships between latent factors and measured variables only shown for rotated factor loadings >0.32 (i.e. where observed variable explains >10% of the variance in the latent factor (0.322 = 0.10)). See methods for further details.

