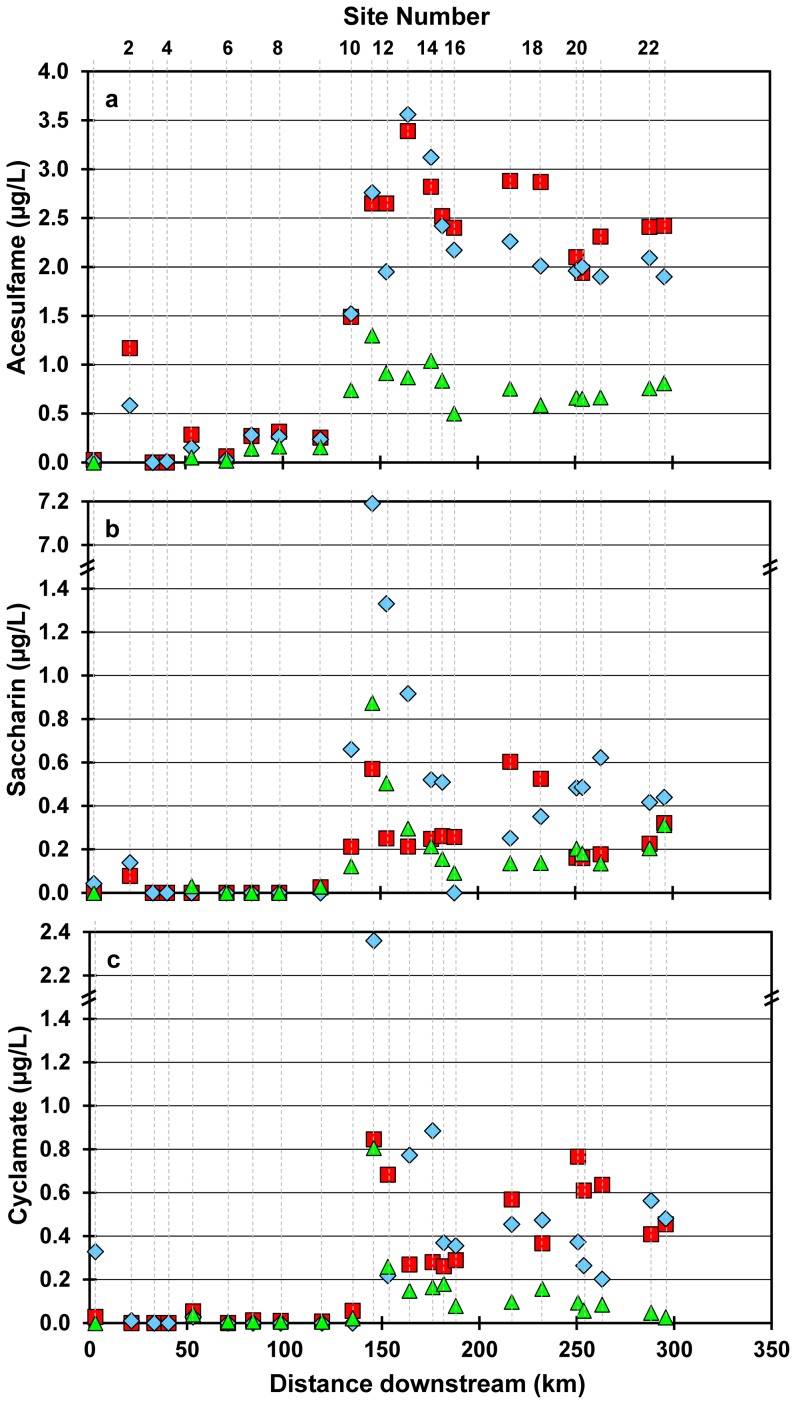
Figure 2. Concentrations of 3 artificial sweeteners in the Grand River.
Acesulfame (a), saccharin (b) and cyclamate (c) concentrations in the Grand River on three sampling dates; Jun 2007 (blue diamonds), Sep 2007 (red squares), Apr 2009 (green triangles). Samples plotted at y = “0” have concentrations less than the minimum detection limit.

