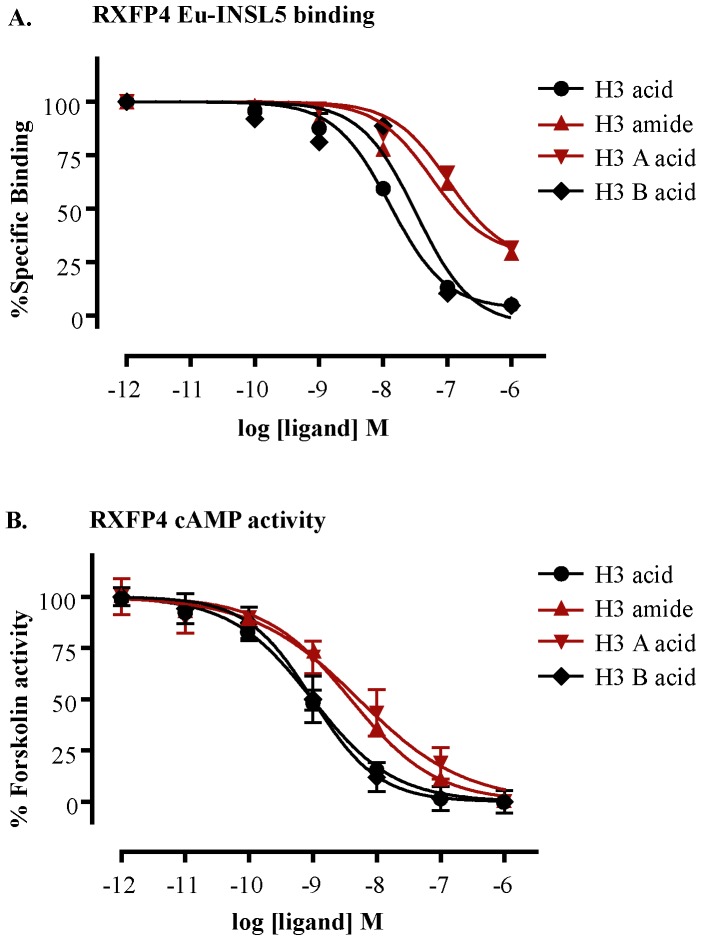
Figure 3. Receptor binding affinity (pKi) and cAMP activity (pEC50) curves of H3 relaxin and its variants at RXFP4.
A) Competition binding curves of H3 relaxin variants at RXFP4 using a single concentration of Eu-INSL5 (2.5 nM) in the presence of increasing concentrations of the H3 relaxin peptides. B) RXFP4 activation curves of H3 relaxin variants measured in a cAMP activity assays in the presence of 1 µM forskolin. The data were expressed as mean ± SEM from at least three independent experiments.

