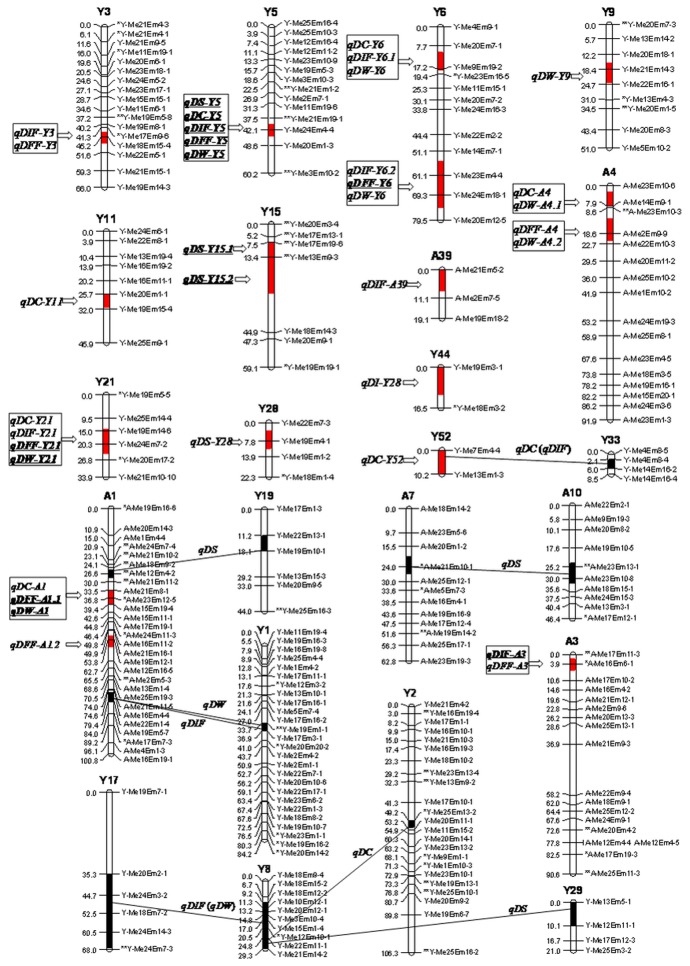
Figure 1. Graphical representation of additive and epistatic QTL for selected flowering time traits.
Loci shown in bold and underlined represent those detected in both cropping years. Lines linking pairs of loci indicate additive x additive epistatic QTL. Genomic regions outlined in red harbor QTL with additive effects, whereas those in black harbor those which interact epistatically. Genomic regions containing QTL clusters are boxed. Days from transplanting to squaring (DS), coloring (DC), initial flowering (DIF), full flowering (DFF) and inflorescence wilting (DW). ** Significant distorted segregating at P < 0.01.

