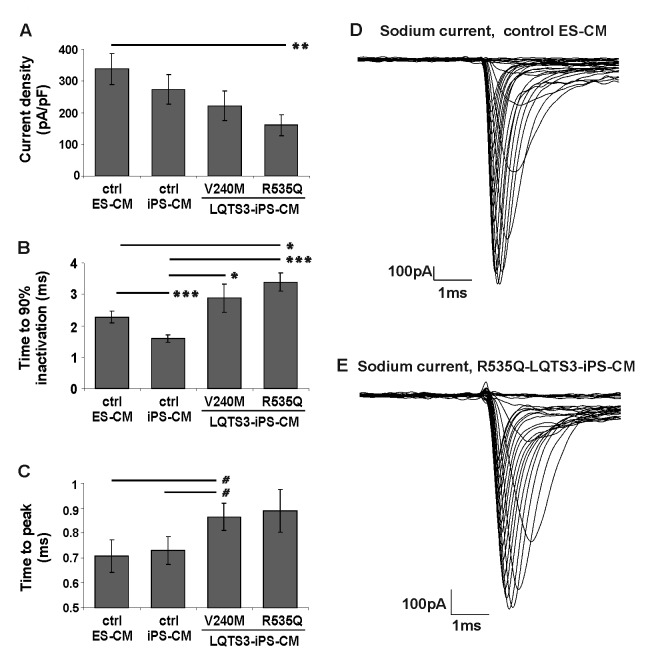
Figure 4. Sodium current measurements in control and LQTS-3 cells.
Voltage-gated Na+ channel currents were recorded in a voltage-clamp mode. Values for current density (A), time of 90% inactivation (B) and time to peak (C) are shown for human ES cell derived CM (n=8), control iPS cell-derived CM (n=11) and for LQTS-3 iPS cell-derived CM from patients NP0012 (p.R535Q, n=13) and NP0016 (p.V240M, n=12). (D,E) Exemplary current traces with an increased persistent sodium current typical of LQTS-3 in diseased R535Q-LQTS-3 CM but not in healthy ES cell-derived CM. Symbols: # p<0.05, * p<0.02, ** p<0.01, ***p<0.005. Differences between all other groups were not statistically significant.

