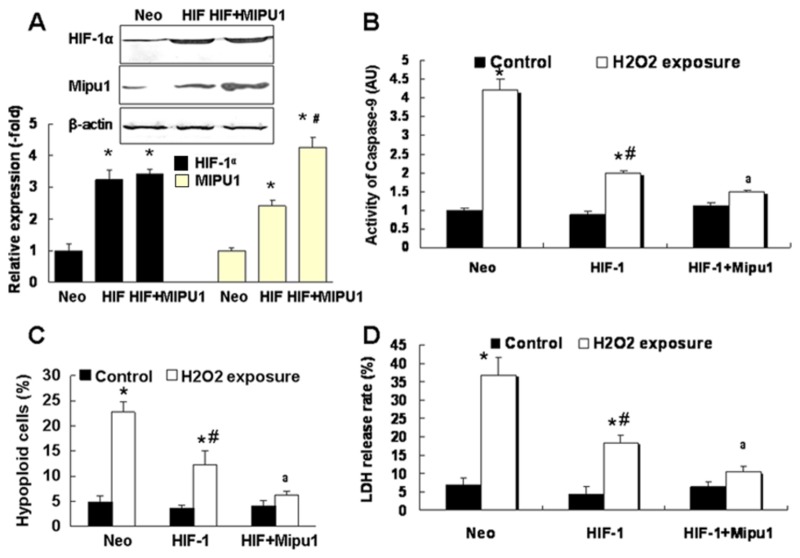
Figure 6. Mipu1 over-expression enhances the cytoprotection of HIF-1α against oxidative stress in H9C2 cells.
“Neo”: pcDNA3.1 vector transfection group; “HIF”: pcDNA3.1-HIF-1α plasmid tranfection; “HIF+Mipu1”: cells cotransfected with pcDNA31-HIF-1α and pcDNA31-Mipu1 plasmids. A: immunoblotting showing the expression of Mipu1 and HIF-1α (n=3), bottom panel showing the semi-quantitative analysis of the Mipu1 and HIF-1α band against β-actin, * p<0.05 versus “Neo”, # p<0.05 versus “HIF” group. B: Colorimetric Assay showing the activity of Caspase-9 (n=4). * p<0.05 versus H2O2-untreated cells, # p<0.05 versus H2O2-treated “Neo” group, a p<0.05 versus H2O2-treated “HIF” alone group; C: flowcytometry detecting the hypoploid cells, * * p<0.05 versus H2O2-untreated cells, # p<0.05 versus H2O2-treated “Neo” group, a p<0.05 versus H2O2-treated “HIF” group, (N=5); D: LDH release rate, * p<0.05 versus H2O2-untreated cells, # p<0.05 versus H2O2-treated “Neo”group, a p<0.05 versus H2O2-treated “HIF” group, n=5.

