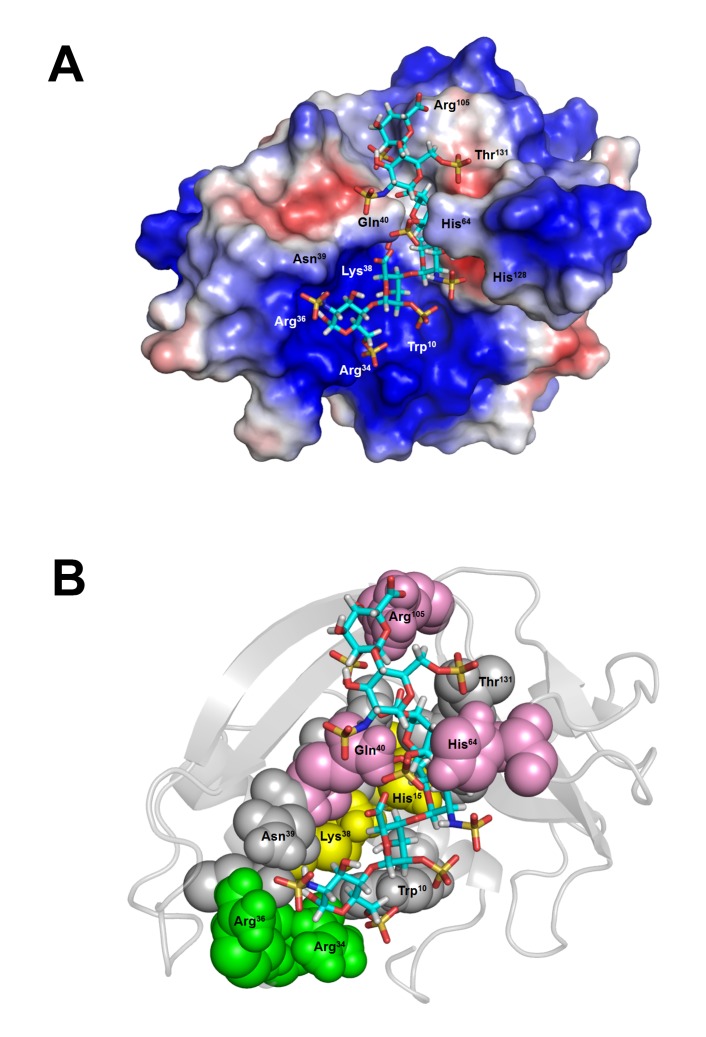
Figure 3. Predicted ECP-Hep6 interaction.
(A) wtECP surface was colored according to the electrostatic potential. Blue, red and white color indicated respectively a region of positive (+ 67 kT/e), negative (- 67 kT/e), and neutral potential. (B) wtECP structure was presented in cartoon and the residues interacting with Hep6 were shown in colored spheres with indicated numbers: residues located at RNase active sites were in yellow, residues located at HBR1ecp were in green, residues with large contribution in docking simulation were in pink, and other residues were in gray. Hep6 was shown in stick and CPK color.

