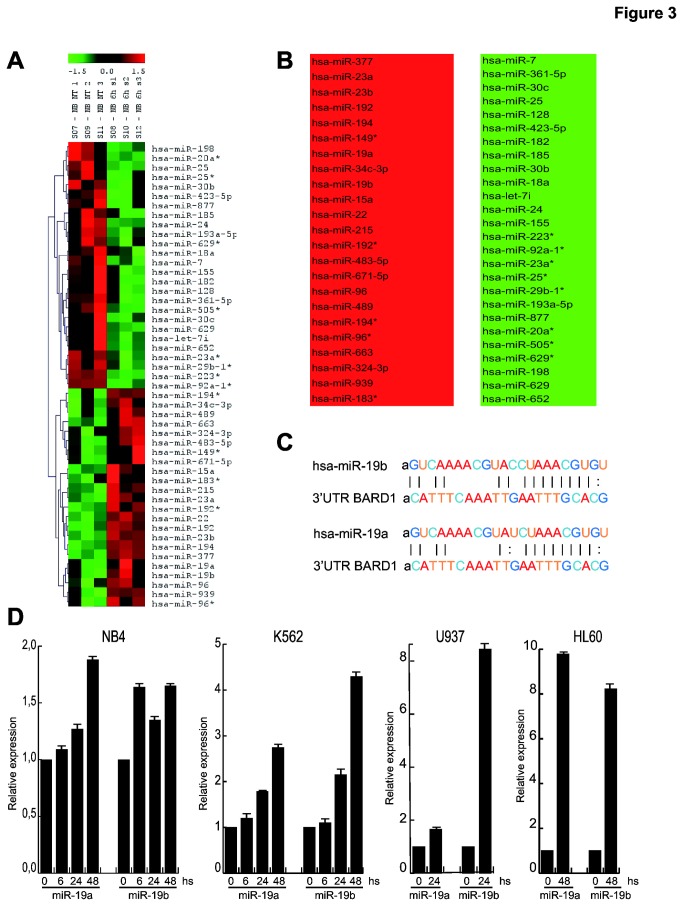
Figure 3. Vorinostat induces overexpression of different miRNAs in human AML cell lines.
(A) Heat-map of miRNAs altered in NB4 cells after treatment with Vorinostat (5 µM) for 6 h (s); the experiment was performed in biological triplicate and the t-test analysis was carried out between NB4 untreated (NB NT 1-3) and NB4 treated with Vorinostat (NB 6h s1-3); p-value ≤ 0.10. (B) Table of miRNAs up-regulated (in red) and down-regulated (in green) after Vorinostat treatment; p-value ≤ 0.10. (C) Annealing of miR-19a and miR-19b to BARD1 3’UTR. (D) Real-Time PCR for miR-19a and miR-19b in NB4, K562, U937 and HL60 cells after Vorinostat at a concentration of 5 µM. Data show the mean value of three parallel experiments with error bars showing the standard deviations on top of each column.

