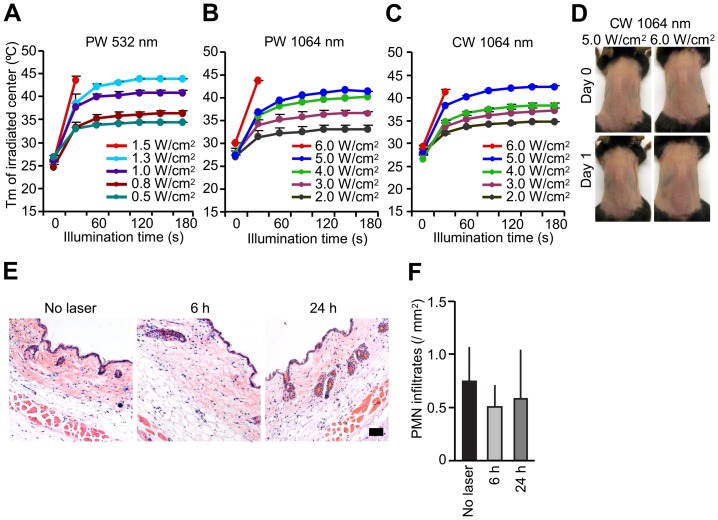
Figure 1. Effect of laser on skin tissue.
A–C, Dose-temperature responses of the PW 532 nm laser and the PW and CW 1064 nm laser in mouse skin. n = 1–4 (4–16 exposures in total) for each group. PW, pulse wave; CW, continuous wave; Tm, maximal skin surface temperature. Error bars show means ± s.e.m. D, Images of the back of mice for visual inspection at 0 and 24 hours after the CW 1064 nm NIR laser treatment. Representative images for each group are presented. A–D, n = 1–4 (4–16 exposures in total) for each group. E, Microscopic assessment of skin damage and inflammatory infiltration after laser treatment. Representative time-course images of hematoxylin-eosin-stained skin tissue are presented. The bar indicates 50 µm. F, Quantification of polymorphonuclear leukocytes (PMN) after the NIR laser treatment. E–F, n = 3 for each group.

