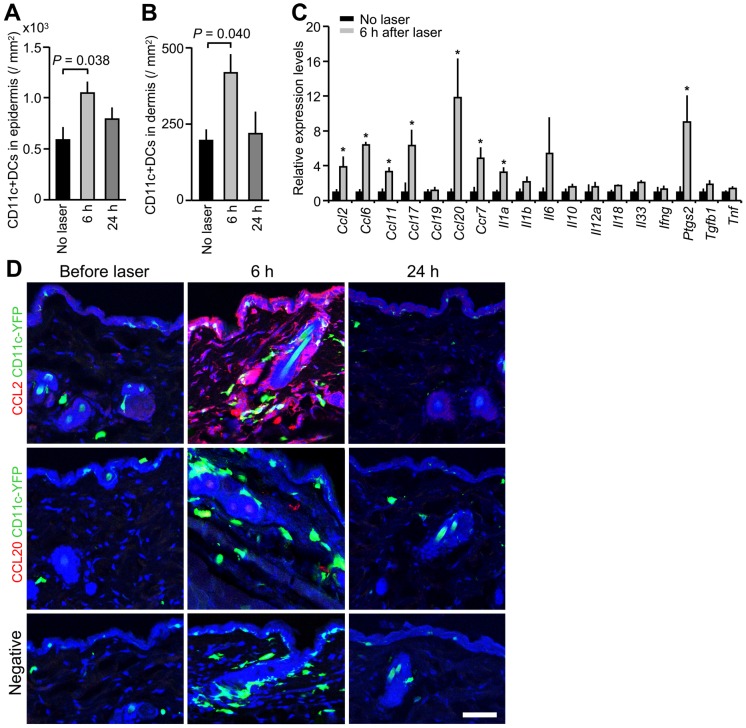
Figure 5. Effect of the near-infrared (NIR) laser adjuvant on the migration of dendritic cells (DCs).
A and B, Quantification of CD11c+ DCs in skin before (n = 6) and at 6 (n = 8) and 24 hours (n = 4) after the NIR laser treatment. The number of DCs in the (A) epidermal and (B) dermal compartments; ANOVA with Bonferroni correction. A–B, Data are derived from at least three independent experiments. C, Relative gene expression of inflammatory cytokines and chemokines in the skin 6 hours after laser treatment (n = 4–5) and in the no laser control mice (n = 4) was quantified by qPCR. *P<0.05 as compared with control mice; Student's unpaired two-tailed t test. A–C, Error bars show means ± s.e.m. D, Confocal imaging of CCL2 expression (red, top row), CCL20 expression (red, middle row), CD11c+ DCs (green) and nuclear counterstaining (To-Pro-3 in blue) in skin before treatment and at 6 and 24 hours after the NIR laser treatment. Images are representative from three independent experiments. Scale bar, 50 µm.

