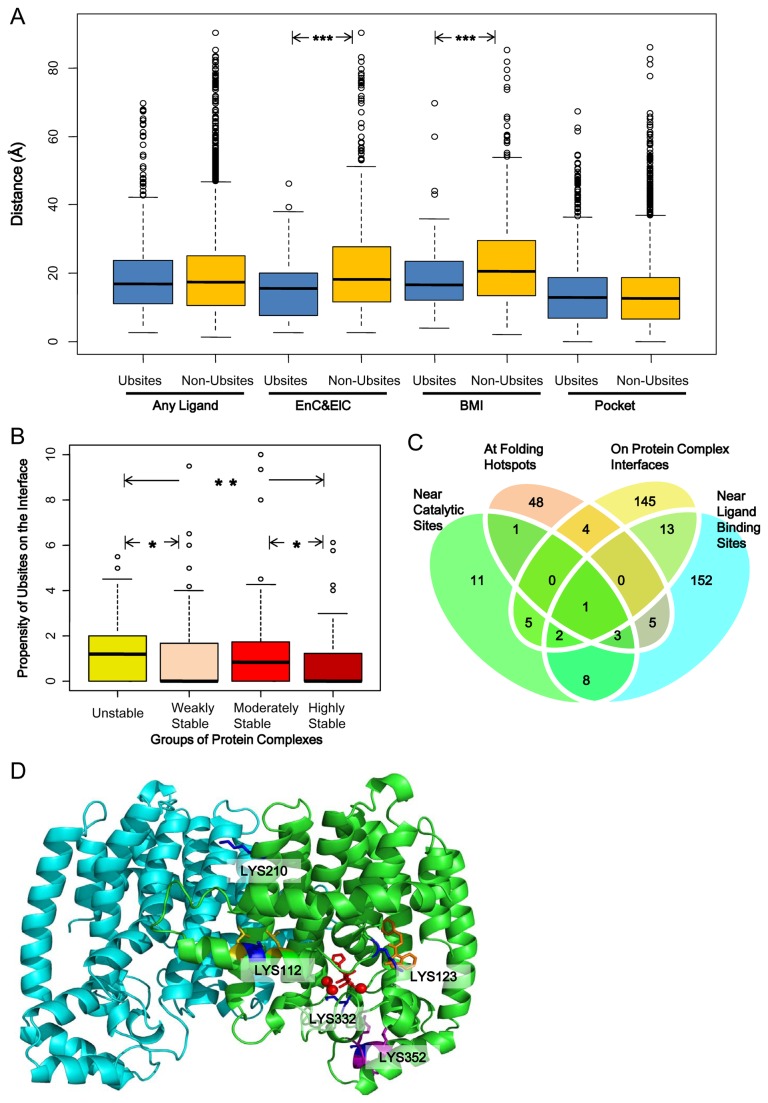
Figure 2. Wide association between ubiquitination sites and functional sites in the structures.
(A) Boxplot showing the distribution of the shortest distance between Ubsites/Non-Ubsites and the ligands/largest pockets. EnC&ElC, energy currency and electron carrier; BMI, bivalent metal ion. (B) Boxplot showing difference in the propensity of Ubsites on the interface between different groups of complexes. The statistical significance in panel A and B (if any) is labeled as: *, p<0.05; **, p<0.01, ***, p<0.001. (C) The Venn diagram shows the overlap of the Ubsites that are associated with different types of functional sites. (D) The cartoon representation of the farnesyl pyrophosphate synthase, on which five Ubsites (blue) are highlighted. Red stick, the inhibitor zoledronic acid targeting the substrate pocket; red ball, Mg2+ ions; orange stick, an allosteric inhibitor; yellow residues, two folding hotspots; purple residues, the KEN motif.

