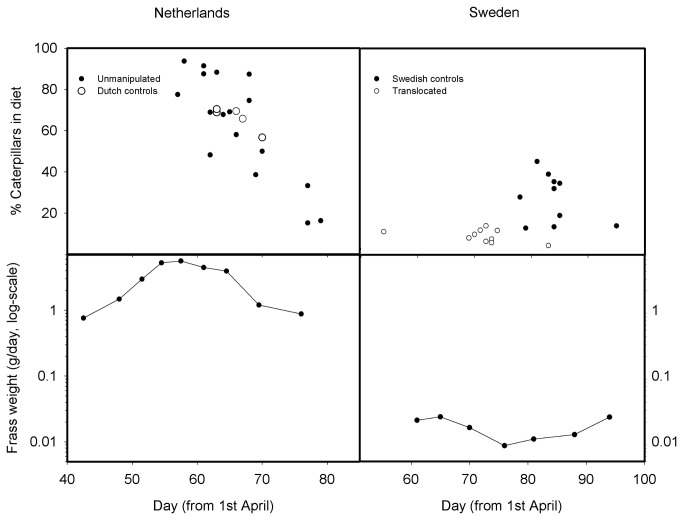
Figure 1. Percentage of caterpillars in nestling diet and caterpillar frass weights.
Both nestling diet and frass weights (g per day per frass-net) are shown in relationship with date (for frass-nets: mean date between two sampling events), for Sweden and The Netherlands. Dutch broods showed a steep decline in the proportion of caterpillars in the diet with date, which was not the case for Swedish birds where proportions were generally lower.

