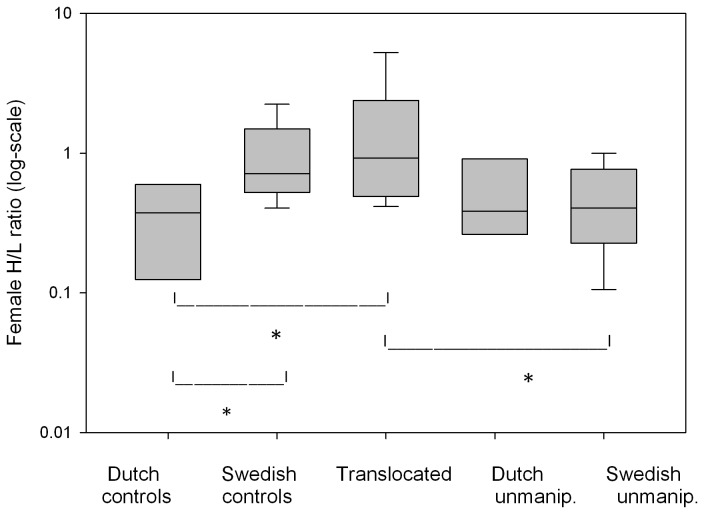
Figure 3. H/L ratios of female pied flycatchers.
Values are shown for the three treatment groups and un-manipulated birds in the Netherlands and Sweden. Medians are shown, with boxes for the 25% to 75% percentiles and whiskers for 10% to 90% of the data. Higher values indicate more stress. H/L values are presented on a log-scale. Translocated and Swedish control females had significantly higher H/L values (means: 1.55 and 1.0, respectively) than the Dutch controls (mean: 0.40), while there was no significant difference between the two experimental groups breeding in Sweden. Significant differences (p<0.05) of post-hoc pairwise comparisons of groups are indicated by stars.

