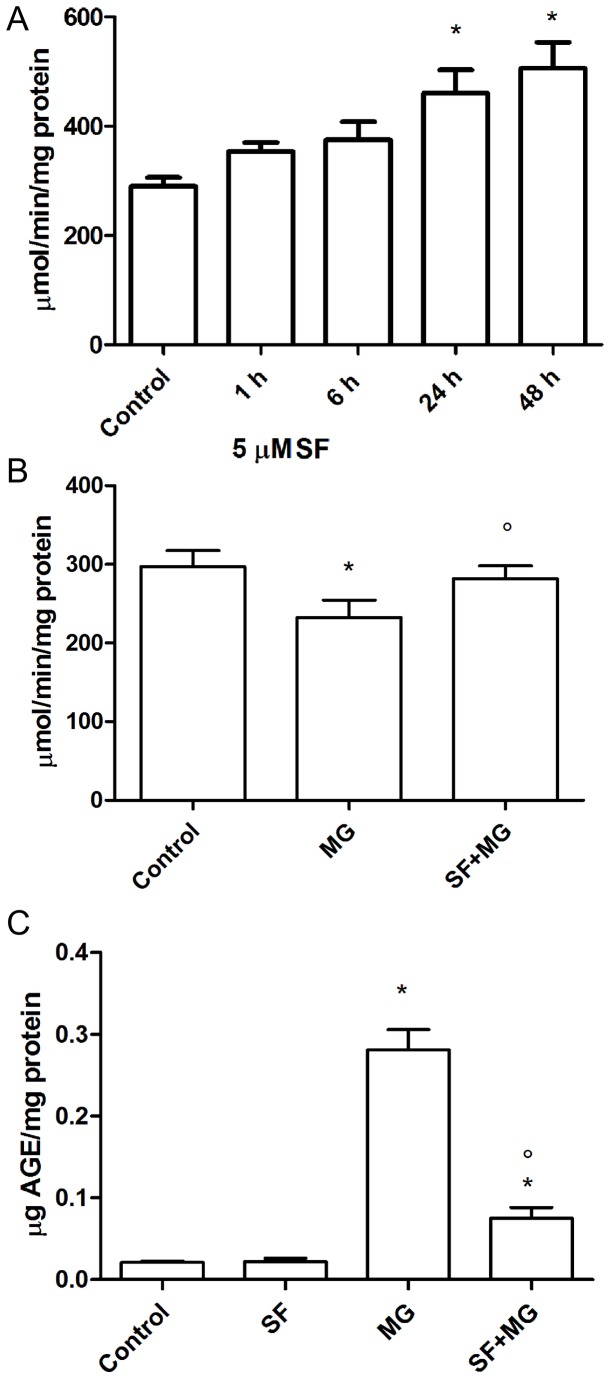
Figure 9. Effect of SF against MG-induced glycation.
(A) Cardiomyocytes were treated with 5 µM SF for different time intervals (1-48 h) and GLO1 enzyme activity was measured by a spectrophotometric method. (B) Cardiomyocytes were treated with 5 µM SF for 24 h before addition of 1 mM MG, and GLO1 enzyme activity was measured by a spectrophotometric method. (C) Cardiomyocytes were treated with 5 µM SF for 24 h before addition of 1 mM MG, and AGE formation was evaluated by AGE-ELISA using a specific anti-AGE antibody. Data are presented as mean ± SD, n = 4 in each group, * p<0.05 vs Control; ° p<0.05 vs MG.

