
Figure 7. Tissue marker analysis in SP600125-induced ectopic tails.
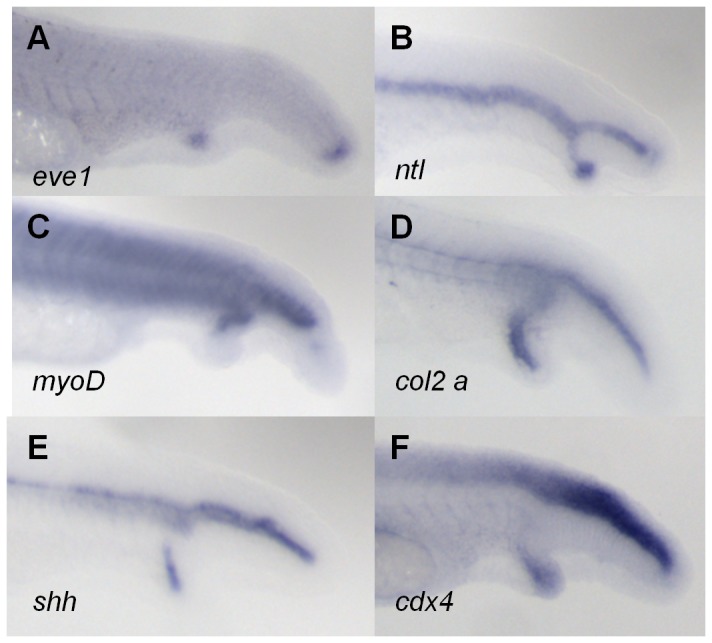
(A) eve1; (B) ntl; (C) myoD; (D) col2a; (E) shh; and (F) cdx4 expression. All embryos were pulsed with 140 μM pCAME for 1h at tailbud stage and fixed at 30 hpf. Lateral views.
Official websites use .gov
A
.gov website belongs to an official
government organization in the United States.
Secure .gov websites use HTTPS
A lock (
) or https:// means you've safely
connected to the .gov website. Share sensitive
information only on official, secure websites.
(A) eve1; (B) ntl; (C) myoD; (D) col2a; (E) shh; and (F) cdx4 expression. All embryos were pulsed with 140 μM pCAME for 1h at tailbud stage and fixed at 30 hpf. Lateral views.