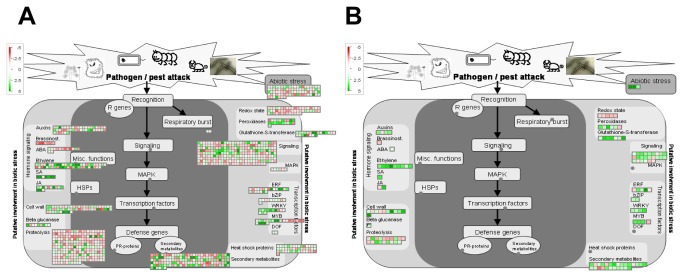
Figure 3. MapMan illustration depicting the transcripts from the “Biotic stress” BIN regulated under pathogenic conditions.
Transcriptomic data from bacteria-inoculated leaves were compared to their respective controls (mock-inoculated). Genes that were shown to be differentially expressed were mapped using the MapMan software (http://mapman.gabipd.org). Picture shows genes related to biotic stress regulated in MG-20 (A) and Gifu (B). Log fold change ratios are indicated as a gradient of red (down-regulated) and green (up-regulated).

