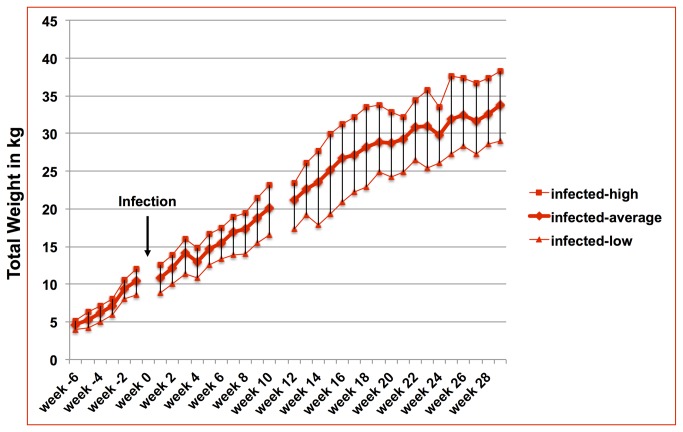
Figure 3. Range of weight development of infected goats.
Average weight development of infected goats together with the highest and lowest weight per measuring point. The arrow marks the time point of infection. Week numbers reflect the time compared to the time point of infection with negative numbers representing weeks prior to infection and positive numbers representing weeks after infection.

