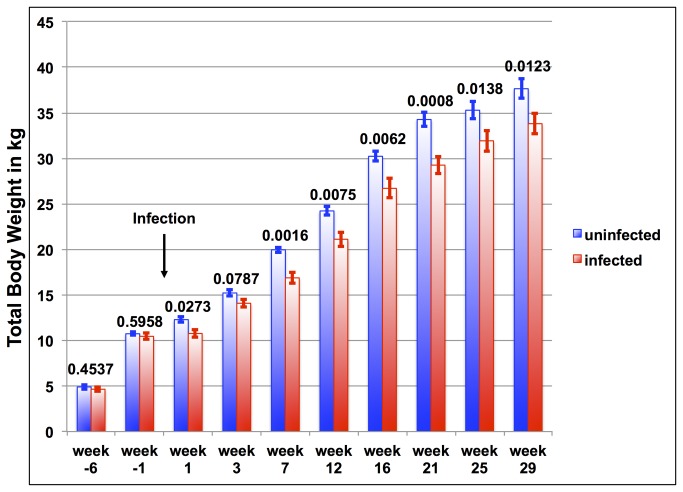
Figure 4. Comparison of the average of total body weight of infected goats (red columns) and uninfected goats (blue columns) of selected weeks.
Above each column pair is the p-value corresponding to the comparison. The time point of infection is marked with an arrow. Error bars represent the standard error for each time point.

