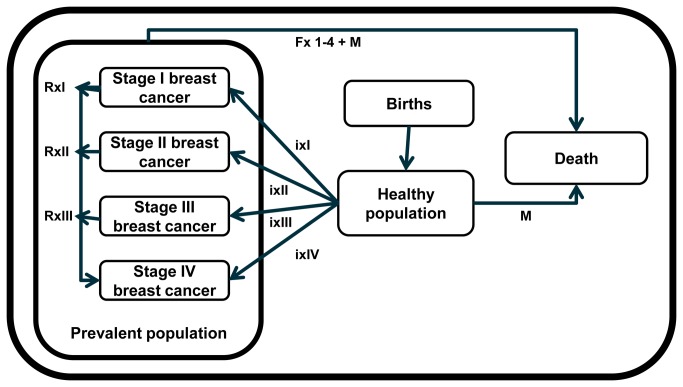
Figure 1. Graphical representation of the model.
Graphical representation of the model showing the relationships between the different health states through the incidence rates of breast cancer (Ix1–Ix4), the different stage specific case fatality rates (Fx1–4), and the background mortality (M). Stage specific relapse rates to stage IV were used to correct the disability weights (Rx1–Rx3).

