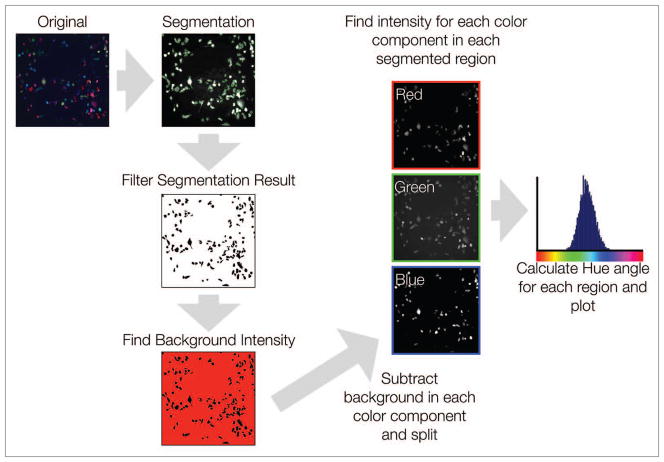
Figure 3.
Image analysis. Images were first analyzed by performing unbiased automatic segmentation on a grayscale image of the cell populations. After segmentation, the background intensities for red, green, and blue were determined by finding the average intensity of the area remaining after removing the segmented regions from the original image. This background intensity was then subtracted from the red, green and blue channel images. From these background-subtracted images, the red, green and blue intensities of segmented regions were then determined, and the hue of each region calculated and plotted.

