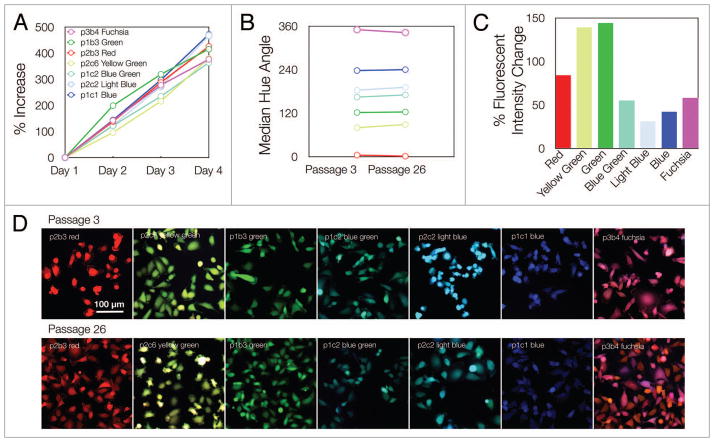
Figure 4.
Growth characteristics. (A) The seven MDA-MB-231 clones were grown in separate wells over four days. The proliferation rate was determined using the described segmentation framework to produce unbiased counts of cells (Day 1 had ~600 counted cells for each individual clone). (B) To determine the stability of fluorescent protein expression and the suitability of the clones for long-term experiments, the median hue angle for populations of cells (~8000 cells) was measured at an early passage as well as 6 mo later after continuous cell growth and expansion. (C) Cell fluorescent intensities from passage 3 and passage 26 were taken and are displayed as the percent of change across passages. (D) Individual images for each monoclonal population at an early passage (3) and late passage (26).

