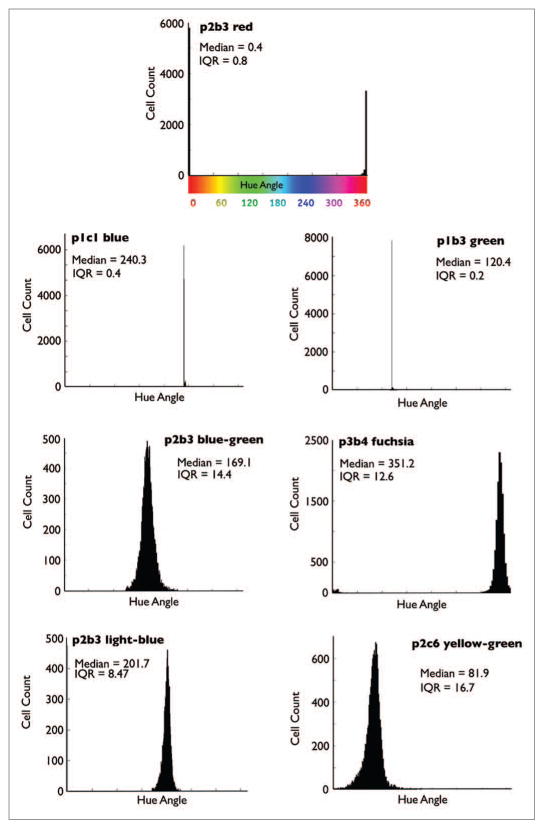
Figure 5.
Hue angle histogram analysis of individual clones. The seven MDA-MB-231 clones were grown separately, and approximately 8000 individual cells were analyzed and plotted. Each plot shows the population median as well as the interquartile range (IQR: the difference between the 25th and 75th percentile).

