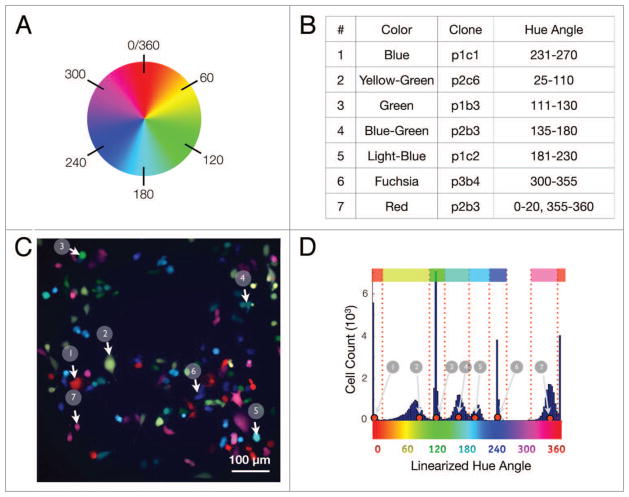
Figure 6.
Hue analysis. (A) A generic color wheel depicting the locations of the hue angles. (B) Cutoff analysis for MDA-MB-231 cells for each of 7 hue types based on a mixed data set. (C) A typical image from a mixed MDA-MB-231 7-color set (white arrows indicate examples of each colored clone). (D) Spectral analysis of combined cells from mixed cell data sets. The top row and dotted red lines indicate the cutoff points separating each clonal subtype.

