Fig. 3.
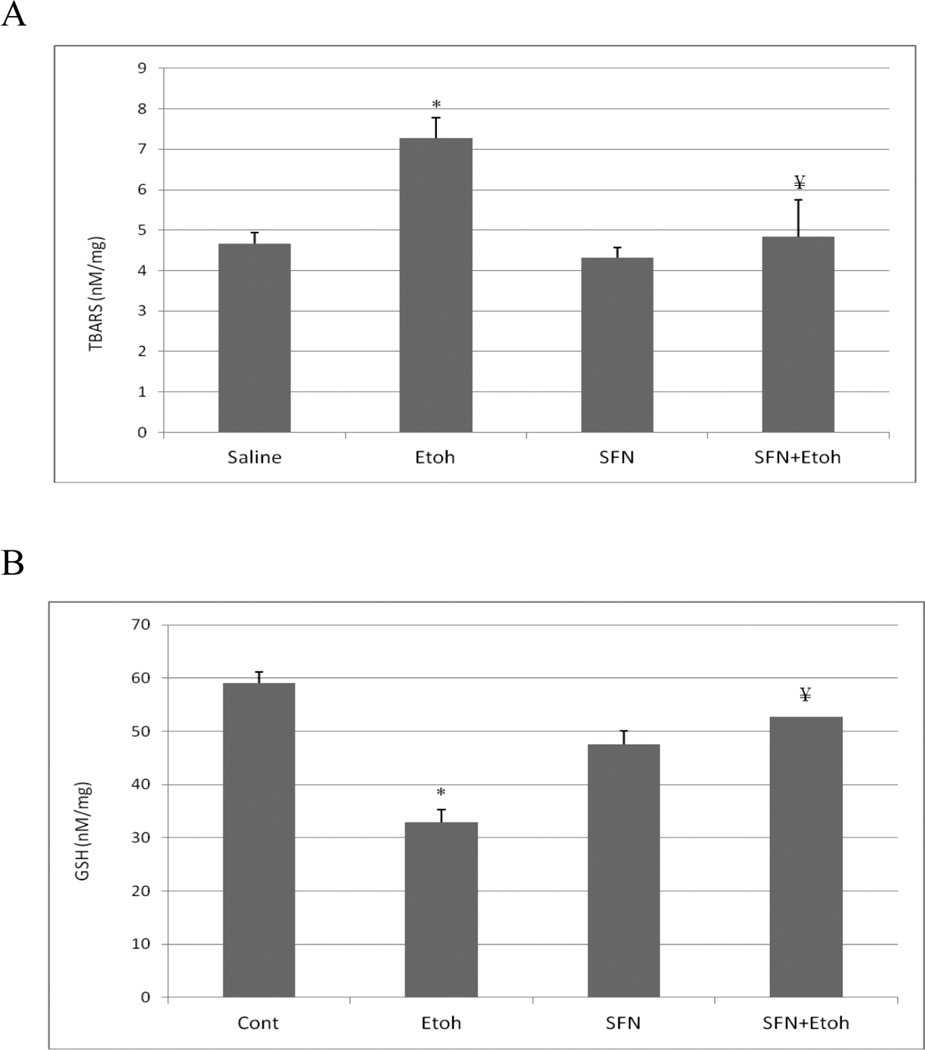
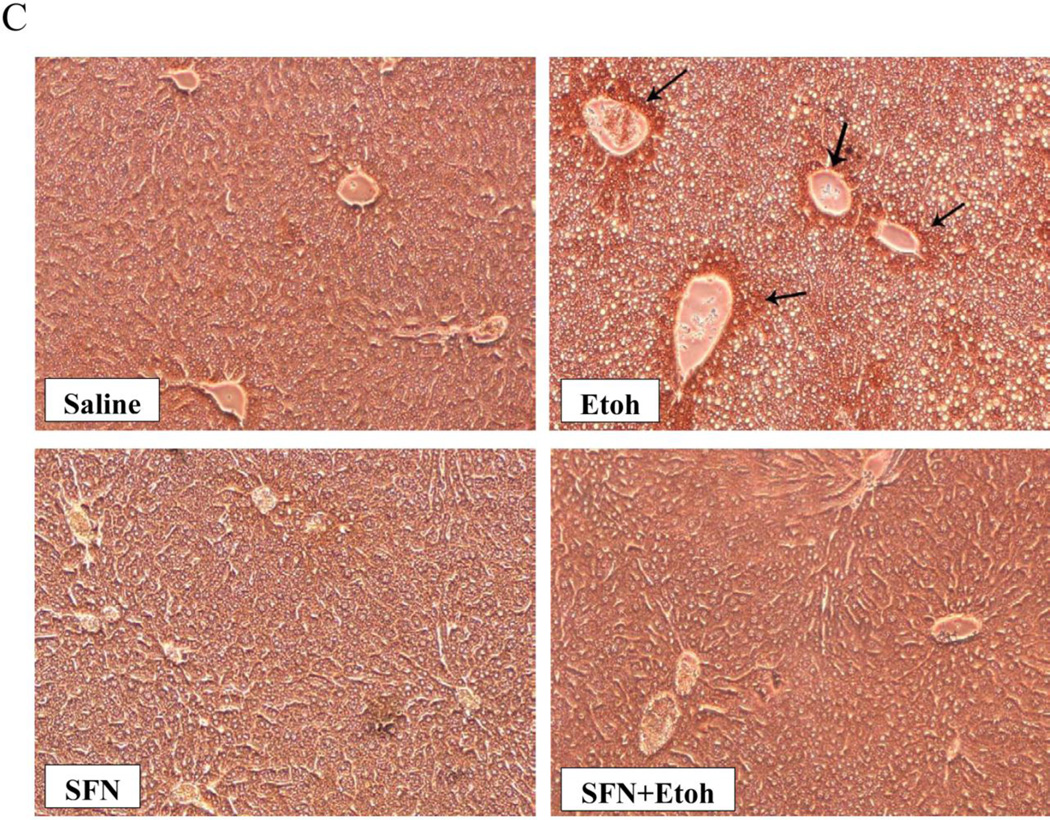
Sulforaphane treatment blunts binge-ethanol-induced oxidative stress. Mice were treated with ethanol in the absence or presence of sulforaphane as described in the legend to Fig. 1. A; Hepatic levels of TBARs as a reflection of lipid peroxidation. B; Hepatic levels of GSH. C: Immunohistochemical staining for 3-NT protein adducts in liver. Results for A and B are from 3 experiments. * P< 0.05 for the ethanol –induced increase in TBARs or decrease in GSH compared to saline. ¥ P<0.05 for the effect of sulforaphane on the ethanol-induced changes. Arrows in C point to the pericentral zone of the liver acinus.


