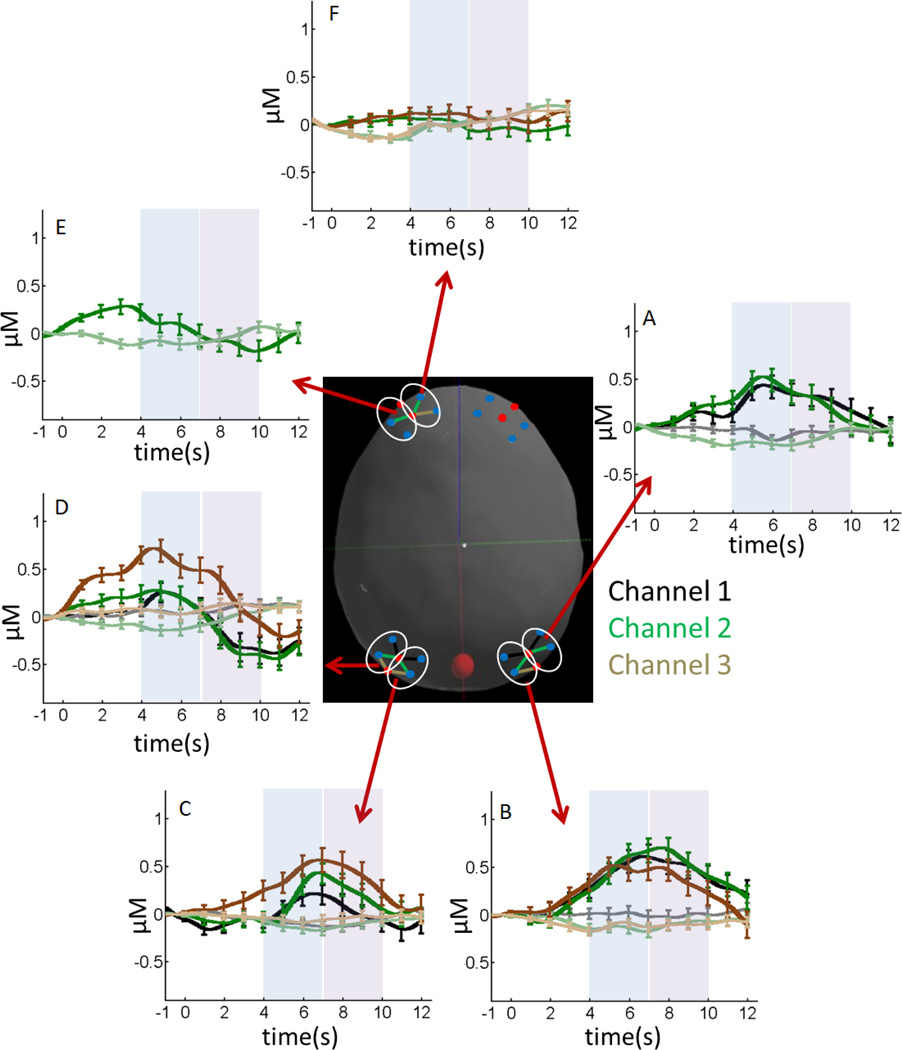
Figure 6.
Concentrations of oxy-Hb (dark colors) and deoxy-Hb (light colors) for fNIRS channels showing a difference in the concentration of these chromophores during the early phase (4–7 s; see blue shaded time window) or late phase (7–10 s; see magenta shaded time window). The center image shows the selected fNIRS channels. The color of these channels matches the dark-light color pairs in each panel (e.g., dark green line in panel A shows oxy-Hb for channel P6-2; light green line shows deoxy-Hb). Error bars show 1 SE averaged over 1 s intervals.

