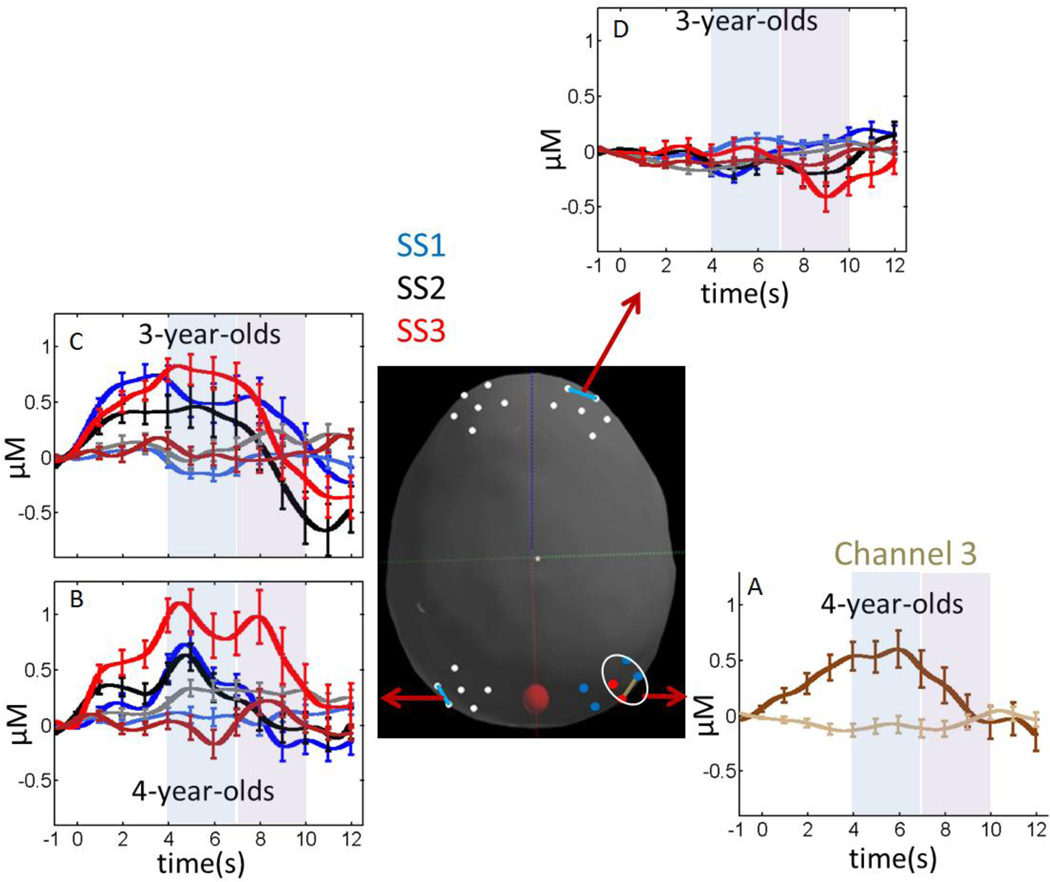
Figure 8.
Concentrations of oxy-Hb (dark colors) and deoxy-Hb (light colors) for fNIRS channels showing robust Age effects. Brown color in panel A follows the colors scheme from Figure 6 (dark brown = oxy-Hb; light brown = deoxy-Hb). Colors in panels B, C, and D follow the color scheme from Figure 7: blue lines = SS1; black lines = SS2; red lines = SS3. The center image shows the selected fNIRS channel depicted in each panel. Error bars show 1 SE averaged over 1 s intervals.

