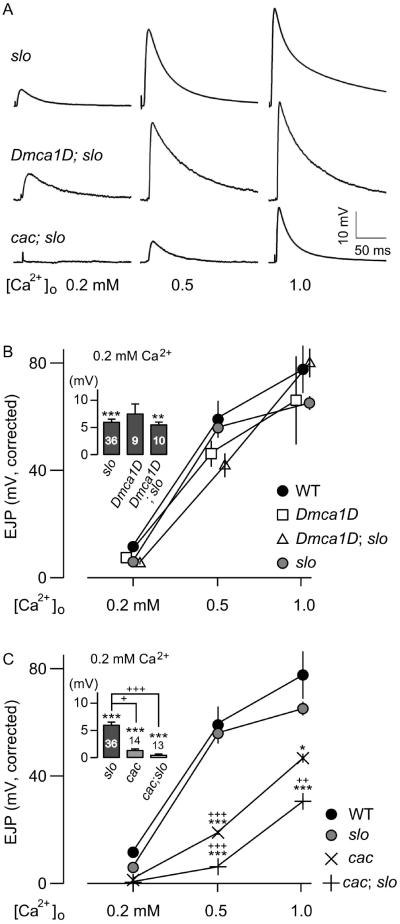
Figure 3.
Effects of cac and Dmca1D mutations on slo EJP amplitude in double-mutant combinations. (A) Representative traces of EJPs at different [Ca2+]o for slo, cacs;;slo, and Dmca1DAR66;slo larvae. Note similar response amplitudes between slo and Dmca1DAR66;slo in contrast to smaller EJPs in cacs;;slo. (B) Pooled EJP data for Dmca1DAR66, slo, and the double mutants. (C) Pooled EJP data for cacs, slo, and the double mutants. Note further reduction in EJP amplitudes at different Ca2+ levels in cacs;;slo double mutants compared to cac single mutants. EJP amplitudes are corrected for nonlinear summation (see Methods). The insets show at a higher resolution the differences in EJP amplitudes at 0.2 mM [Ca2+]o. Mean ± SEM are indicated. * or +, P<0.05, ** or ++, P<0.01 and *** or +++, P<0.001, One-way ANOVA with Fisher’s LSD test for multiple comparisons, WT (*) or slo (+) vs. genotypes indicated.

